the Creative Commons Attribution 4.0 License.
the Creative Commons Attribution 4.0 License.
 | 06 Feb 2020
Using passive and active observations at microwave and sub-millimetre wavelengths to constrain ice particle models
Patrick Eriksson
Simon Pfreundschuh
Satellite microwave remote sensing is an important tool for determining the distribution of atmospheric ice globally. The upcoming Ice Cloud Imager (ICI) will provide unprecedented measurements at sub-millimetre frequencies, employing channels up to 664 GHz. However, the utilization of such measurements requires detailed data on how individual ice particles scatter and absorb radiation, i.e. single scattering data. Several single scattering databases are currently available, with the one by Eriksson et al. (2018) specifically tailored to ICI. This study attempts to validate and constrain the large set of particle models available in this database to a smaller and more manageable set. A combined active and passive model framework is developed and employed, which converts CloudSat observations to simulated brightness temperatures (TBs) measured by the Global Precipitation Measurement (GPM) Microwave Imager (GMI) and ICI. Simulations covering about 1 month in the tropical Pacific Ocean are performed, assuming different microphysical settings realized as combinations of the particle model and particle size distribution (PSD).
Firstly, it is found that when the CloudSat inversions and the passive forward model are considered separately, the assumed particle model and PSD have a considerable impact on both radar-retrieved ice water content (IWC) and simulated TBs. Conversely, when the combined active and passive framework is employed instead, the uncertainty due to the assumed particle model is significantly reduced. Furthermore, simulated TBs for almost all the tested microphysical combinations, from a statistical point of view, agree well with GMI measurements (166, 186.31, and 190.31 GHz), indicating the robustness of the simulations. However, it is difficult to identify a particle model that outperforms any other. One aggregate particle model, composed of columns, yields marginally better agreement with GMI compared to the other particles, mainly for the most severe cases of deep convection. Of the tested PSDs, the one by McFarquhar and Heymsfield (1997) is found to give the best overall agreement with GMI and also yields radar dBZ–IWC relationships closely matching measurements by Protat et al. (2016). Only one particle, modelled as an air–ice mixture spheroid, performs poorly overall. On the other hand, simulations at the higher ICI frequencies (328.65, 334.65, and 668.2 GHz) show significantly higher sensitivity to the assumed particle model. This study thus points to the potential use of combined ICI and 94 GHz radar measurements to constrain ice hydrometeor properties in radiative transfer (RT) using the method demonstrated in this paper.


Active and passive microwave instruments are useful for measuring the mass of ice hydrometeors. This is, for example, relevant for deep convection systems and associated anvil cirrus (high-altitude ice clouds), which are dominant features of the intertropical convergence zone and play a major role in the earth radiative energy budget, climate, and hydrological cycle. Accurate measurements of these tropical clouds are important from a weather and climate prediction point of view. Because clouds are semi-transparent at microwave frequencies, measured signals are related to the integrated column of ice hydrometeors. Depending on the exact measurement frequency, sensitivity to different particle sizes is gained. Radars utilize frequencies up to 95 GHz and are predominantly sensitive to larger, presumably precipitating hydrometeors, e.g. snow. Radiometers that make use of frequencies above 300 GHz, i.e. sub-millimetre frequencies, are instead sensitive to smaller particles and consequently useful for measuring ice clouds (Buehler et al., 2007). In order to estimate the total ice mass accurately, a suitable combination of frequencies should be chosen in order to offer sensitivity to the particle sizes contributing the most to the total mass for varying conditions.
In order to provide global datasets, satellite-borne instrumentation is required. Microwave radiometers typically provide excellent horizontal coverage but poor vertical resolution (Bühl et al., 2017). As a prominent example, the Global Precipitation Measurement (GPM) core satellite carries the GPM Microwave Imager (GMI), a conical scanning microwave radiometer with channels up to 183.31 GHz, for estimating rain and snowfall (Hou et al., 2014). Overall, however, there is currently a lack of global data on ice cloud mass, since present sensors operate at frequencies below 190 GHz, at which the sensitivity to smaller particles is low. The Ice Cloud Imager (ICI) aboard the upcoming MetOp-SG satellite will address this issue, employing channels in the sub-millimetre region at frequencies up to 664 GHz. The suitability of sub-millimetre wavelengths for retrievals of cloud ice has been demonstrated practically by a number of airborne instruments, including the airborne ICI demonstrator International Sub-millimetre Airborne Radiometer (ISMAR) (Fox et al., 2019; Brath et al., 2018) and the Compact Scanning Submillimeter-wave Imaging Radiometer (CoSSIR)(Evans et al., 2012), but also by a number of limb sounding instruments, including the Aura Microwave Limb Sounder (MLS) (Wu et al., 2006), Superconducting Submillimeter Limb Emission Sounder (SMILES), and Odin sub-millimetre radiometer (SMR) (Eriksson et al., 2014).
Satellite-borne radars, on the other hand, provide excellent vertical resolution globally at the expense of horizontal coverage (Bühl et al., 2017). Currently operating satellite radars are the GPM dual-frequency phased-array precipitation radar (DPR) operating at 13.6 and 35.5 GHz (Hou et al., 2014) and the CloudSat Cloud Profiling Radar (CPR) operating at 94.1 GHz (Stephens et al., 2008). On the ground, weather radars are typically used to estimate precipitation but are also extensively used for research purposes. Furthermore, Doppler radars have demonstrated capabilities to both identify and quantify different water phases in mixed-phase cloud (Shupe et al., 2004), while multi-frequency radars have shown capabilities to retrieve information related to the shape of the ice particles (Kulie et al., 2014; Kneifel et al., 2015; Yin et al., 2017; Leinonen et al., 2018).
In order to utilize remote sensing measurement affected by ice hydrometeors, the single scattering properties of the ice particles must be known. Developing particle models that produce realistic scattering over a large frequency spectrum is difficult. Traditionally, simplistic particle models such as the soft-spheroid particle (i.e. a spheroid composed of an ice–air mixture) have been used in both the active and passive remote sensing communities due to its computational efficiency. Such configurations can yield good results at single frequencies, for instance, through fine-tuning of the particle effective density (Galligani et al., 2015). However, they fail to provide consistent results at multiple frequencies and are not appropriate for multi-frequency measurements and combined passive–active applications (Geer and Baordo, 2014).
These issues have triggered the development of more advanced representations of ice particles in radiative transfer (RT), often with either passive or active applications in mind. Scattering calculations of complex particles are computationally demanding; hence, databases of precalculated single scattering properties are a necessity. The work of Liu (2008) and Hong et al. (2009) could be considered the first efforts at such single scattering databases, aimed specifically at microwave applications. More recent attempts at single scattering databases were published by Lu et al. (2016), Kuo et al. (2016), Ding et al. (2017), and Eriksson et al. (2018). The database by Eriksson et al. (2018), coined the ARTS (Atmospheric Radiative Transfer Simulator) database, was mainly developed in support of the upcoming ICI mission, requiring a frequency coverage up to 668 GHz. A wide range of different particle models is included, with an emphasis on realistic aggregates. However, the wide range of particle models presents a problem and raises the following question: which models are the best representations of ice hydrometeors in reality?
This study is an attempt to assist the utilization of future ICI observations. Specifically, the aim is to validate a selection of particle models from the ARTS database and, if possible, also constrain the number of particle models to a smaller, more manageable set. The validity of a particle model is in this context its ability to accurately reproduce sensor observations in RT modelling. The ARTS database has already seen some analysis in the study by Fox et al. (2019), which reproduced airborne passive measurements by ISMAR. The simulations were based on measurements by lidar and in situ probes that were also carried by the aircraft. It was found that measurements could be simulated with good accuracy. However, accuracy depended heavily upon the assumed particle model and which part of the cloud (e.g. altitude, thickness, age, etc.) was considered, implying that accurate ICI retrievals of cloud ice mass will require realistic particle models. However, the study, while detailed, was limited to two cases of thin cirrus clouds at mid-latitudes. It is of interest to perform a more statistically robust evaluation of particle models, i.e. in a context more globally representative.
In general, the validation of particle models is difficult. In situ aircraft and ground-based measurements give detailed information on particle shape and size distribution, but the coverage is generally highly localized. For mesoscale and larger systems, forward simulations of satellite observations can be used to investigate the impact of the microphysical assumptions upon remote sensing measurements. Typically, atmospheric fields and surface properties taken from a cloud-resolving model are used as input to the forward calculations (Meirold-Mautner et al., 2007; Hong et al., 2010). Furthermore, if real observations are available, they can be confronted with simulated observations to constrain microphysical parameterizations (Sreerekha et al., 2008; Geer and Baordo, 2014; Galligani et al., 2015, 2017). For instance, Geer and Baordo (2014) evaluated the particle models from the database by Liu (2008) by comparing observed (by TMI and SSMIS) to simulated brightness temperatures (TBs) using ECMWF (European Centre for Medium-Range Weather Forecasts) forecasts as input. They found that agreement was improved for most of the Liu particle models in comparison to Mie spheres. However, using model input presents a number of problems. The RT model must be realistic and if the spatial resolution of the model is too coarse, local high concentrations of ice will not be resolved (Burns et al., 1997). Also, numerical weather prediction can typically not predict small-scale cloud structures, making comparisons between simulated and real observations difficult at such scales.
This issue can be circumvented by using radar reflectivity fields as input to the forward model (Bennartz and Bauer, 2003; Skofronick-Jackson et al., 2008; Kulie et al., 2010; Yin and Liu, 2019; Ringerud et al., 2019), ensuring that small-scale cloud structures are properly resolved and represented. Lidar measurements can be used in a similar way, which the already mentioned study by Fox et al. (2019) is an example of. However, this approach is limited to thin clouds that lidars can penetrate. The utilization of measurements by radar requires the reflectivity fields to be converted to fields of ice water content (IWC) (i.e. mass density of ice hydrometeors). The recent study by Yin and Liu (2019) assessed GMI measurements by comparing them to forward simulations derived from collocated CloudSat measurements using a selection of different non-spheroidal particle models. In general, good agreement was attained, especially for the aggregate particle type used. However, Yin and Liu (2019) only derive the IWC field once and used it as input to the forward simulations regardless of the particle type assumed in the latter procedure. This implies that the microphysical assumptions in the forward simulations and the active retrievals are not necessarily consistent. Kulie et al. (2010) assessed particle models by performing RT simulations mimicking passive sensors (AMSR-E and MHS) using IWC input derived from collocated CloudSat CPR measurements as well. Here, the IWC fields are derived repeatedly, with consistent microphysical assumptions in the forward simulations. Hence, consistency between the passive and active model was established. They found that simplistic sphere particle models could not produce results consistent with both the CPR and passive measurements. However, using more complex particle models extracted from scattering databases by Liu (2008) and Hong et al. (2009) performed better overall. No particle was found to perform well in all conditions (e.g. cold clouds, warm clouds, stratiform, etc.), however.
Following the work by Kulie et al. (2010), an effort is made to evaluate the performance of a set different particle models from the ARTS database. Multiple parameterizations of particle size distributions (PSDs) from different sources are considered, since the assumed PSD has a large impact upon simulated observations of clouds. A modelling system that takes radar measurements as input and simulates passive TB measurements was developed. The model operates in two modes. In the first mode, IWC fields from the DARDAR cloud product are used as input. In the second mode, CloudSat radar reflectivities are used as input instead, which are converted to IWC fields using a particle model and size distributions identical to those assumed in the consequent passive forward simulations. Retrieved IWC fields are combined with atmospheric data from the ERA-Interim reanalysis in order to generate synthetic scenes as input for the forward simulations. TBs are simulated at the highest frequencies of GMI using different combinations of particle models and PSDs. The simulated measurements are then compared to GMI observations in a statistical sense in order to test the different microphysical combinations. The scope is limited to daytime simulations in the tropical Pacific Ocean over a period of roughly 1 month. The geographic location avoids issues associated with simulating over land and also ensures that a wide range of weather conditions are covered, including severe storms. Finally, simulations are also performed at the highest ICI frequencies to indicate the validity and possible added value of adding ICI measurements to the analysis performed in this paper.
The paper is structured as follows: Sect. 2 overviews the software used, satellite data, and microphysical data. Section 3 outlines the overall simulation setup and settings, and it also describes the generation of synthetic scenes. Section 4 presents the results. Finally, a discussion, conclusions, and outlook are found in Sects. 5 and 6.
2.1 CloudSat
CloudSat, a sun-synchronous satellite launched in 2006, carries a 94.05 GHz, nadir-looking cloud-profiling radar (CPR) (Stephens et al., 2008). The range resolution is 485 m, while the along- and cross-track resolution is 1.8 and 1.4 km, respectively. As a part of the A-train constellation, the CloudSat CPR has provided collocated products with the Cloud–Aerosol Lidar with Orthogonal Polarization (CALIOP) aboard the CALIPSO satellite. DARDAR (Delanoë and Hogan, 2010) is a synergetic ice cloud retrieval product combining measurements by these two sensors and is one of the most advanced datasets of clouds to date. Bear in mind that radar attenuation by ice and liquid is neglected in this product, however.
The CloudSat data used in this study are extracted from the DARDAR product. Parameters used are DARDAR IWC, the DARDAR-normalized number concentration parameter (), and CloudSat radar reflectivity. The time frame of selected data is from 3 July to 1 August 2015. Geographically, data are extracted from a rectangular area in the Pacific Ocean placed directly at the Equator. The area is limited in latitude by 20∘ S and 20∘ N and in longitude by 170∘ E and 130∘ W. The reason for the selected spatial and temporal frame is given in Sect. 3.1.
2.2 GMI
The Global Precipitation Measurement (GPM) Microwave Imager (GMI) is a conically scanning radiometer with 13 channels in total (Hou et al., 2014). The frequencies of this sensor range from 10.65 to 183.31 GHz, with both h and v polarization at certain frequencies. The channels from 89 to 183.31 GHz have footprint sizes of roughly 6×6 km. GMI is mounted on the GPM satellite, which serves as the core satellite of the GPM constellation. The satellite has a non-sun-synchronous orbit with a 65∘ inclination, which allows for collocated measurements with other satellites in the GPM constellation. GMI can therefore provide inter-sensor calibration for the GPM constellation satellites for the purpose of improved consistency among precipitation products. This study makes use of the vertically polarized measurements at 186.31 and 191.31 GHz. Data are selected within the same spatial and temporal frame as for the DARDAR data, as described in Sect. 2.1.
2.3 ICI
The Ice Cloud Imager (ICI) is an upcoming conically scanning radiometer that will fly on the second-generation meteorological operational satellite (MetOp-SG B) operated by the European Organisation for the Exploitation of Meteorological Satellites (EUMETSAT) and scheduled for launch in 2023. Its main goal is to provide global measurements of ice hydrometeors, and it will fly in a polar sun-synchronous orbit. ICI has 13 channels from 183.31 to 664 GHz. Channels placed at 243 and 664 GHz measure both vertical and horizontal polarization, while the other channels measure vertical polarization only. ICI scans with a 53∘ incidence angle and has a footprint of 15 km. Forward simulations were performed for ICI channels at 328.65, 334.65, and 668.2 GHz.
2.4 ERA-Interim
ERA-Interim is a global atmospheric reanalysis provided by the ECMWF. The parameters used here are pressure, surface, atmospheric temperature, humidity, and cloud liquid water content (CWC). The humidity and CWC fields are not used without modification; they are adjusted in order to be more realistic and agreeable with merged CloudSat data. These modifications are described in detail in Sect. 3.1.
2.5 ARTS
The Atmospheric Radiative Transfer Simulator (ARTS) is an open-source software package that focuses on simulating longwave RT (Buehler et al., 2018). It is intended to describe radiation using the full Stokes vector notation in the most general manner possible, allowing for a large amount of user input flexibility. In itself ARTS behaves as a scripting language on its own. It is oriented towards accuracy and treats particle scattering in a rigorous manner, making it ideal for usage in this study. Several scattering algorithms are available and have been used, including Monte Carlo (Rydberg et al., 2009), RT4 (Fox et al., 2019), and DOIT (Brath et al., 2018). Also available is the DISORT (Discrete Ordinates Radiative Transfer Program for a Multi-Layered Plane-Parallel Medium) algorithm, which is limited to unpolarized radiation. This study only considers totally randomly oriented scattering particles, so this limitation is not a major concern. Furthermore, the method is easy to use, insensitive to settings, and stable. Hence, DISORT was selected as the scattering solver to be used in this study.
2.6 Single scattering data
The ice particle single scattering properties to be evaluated in this study are provided in the publicly available database by Eriksson et al. (2018), referred to as the ARTS scattering database, as it covers the scope of this study in terms of frequencies and the selection of particle models. It provides scattering data for a total of 34 particle models, 34 frequencies between 1 and 886.4 GHz, and three temperatures at 190, 230, and 270 K.
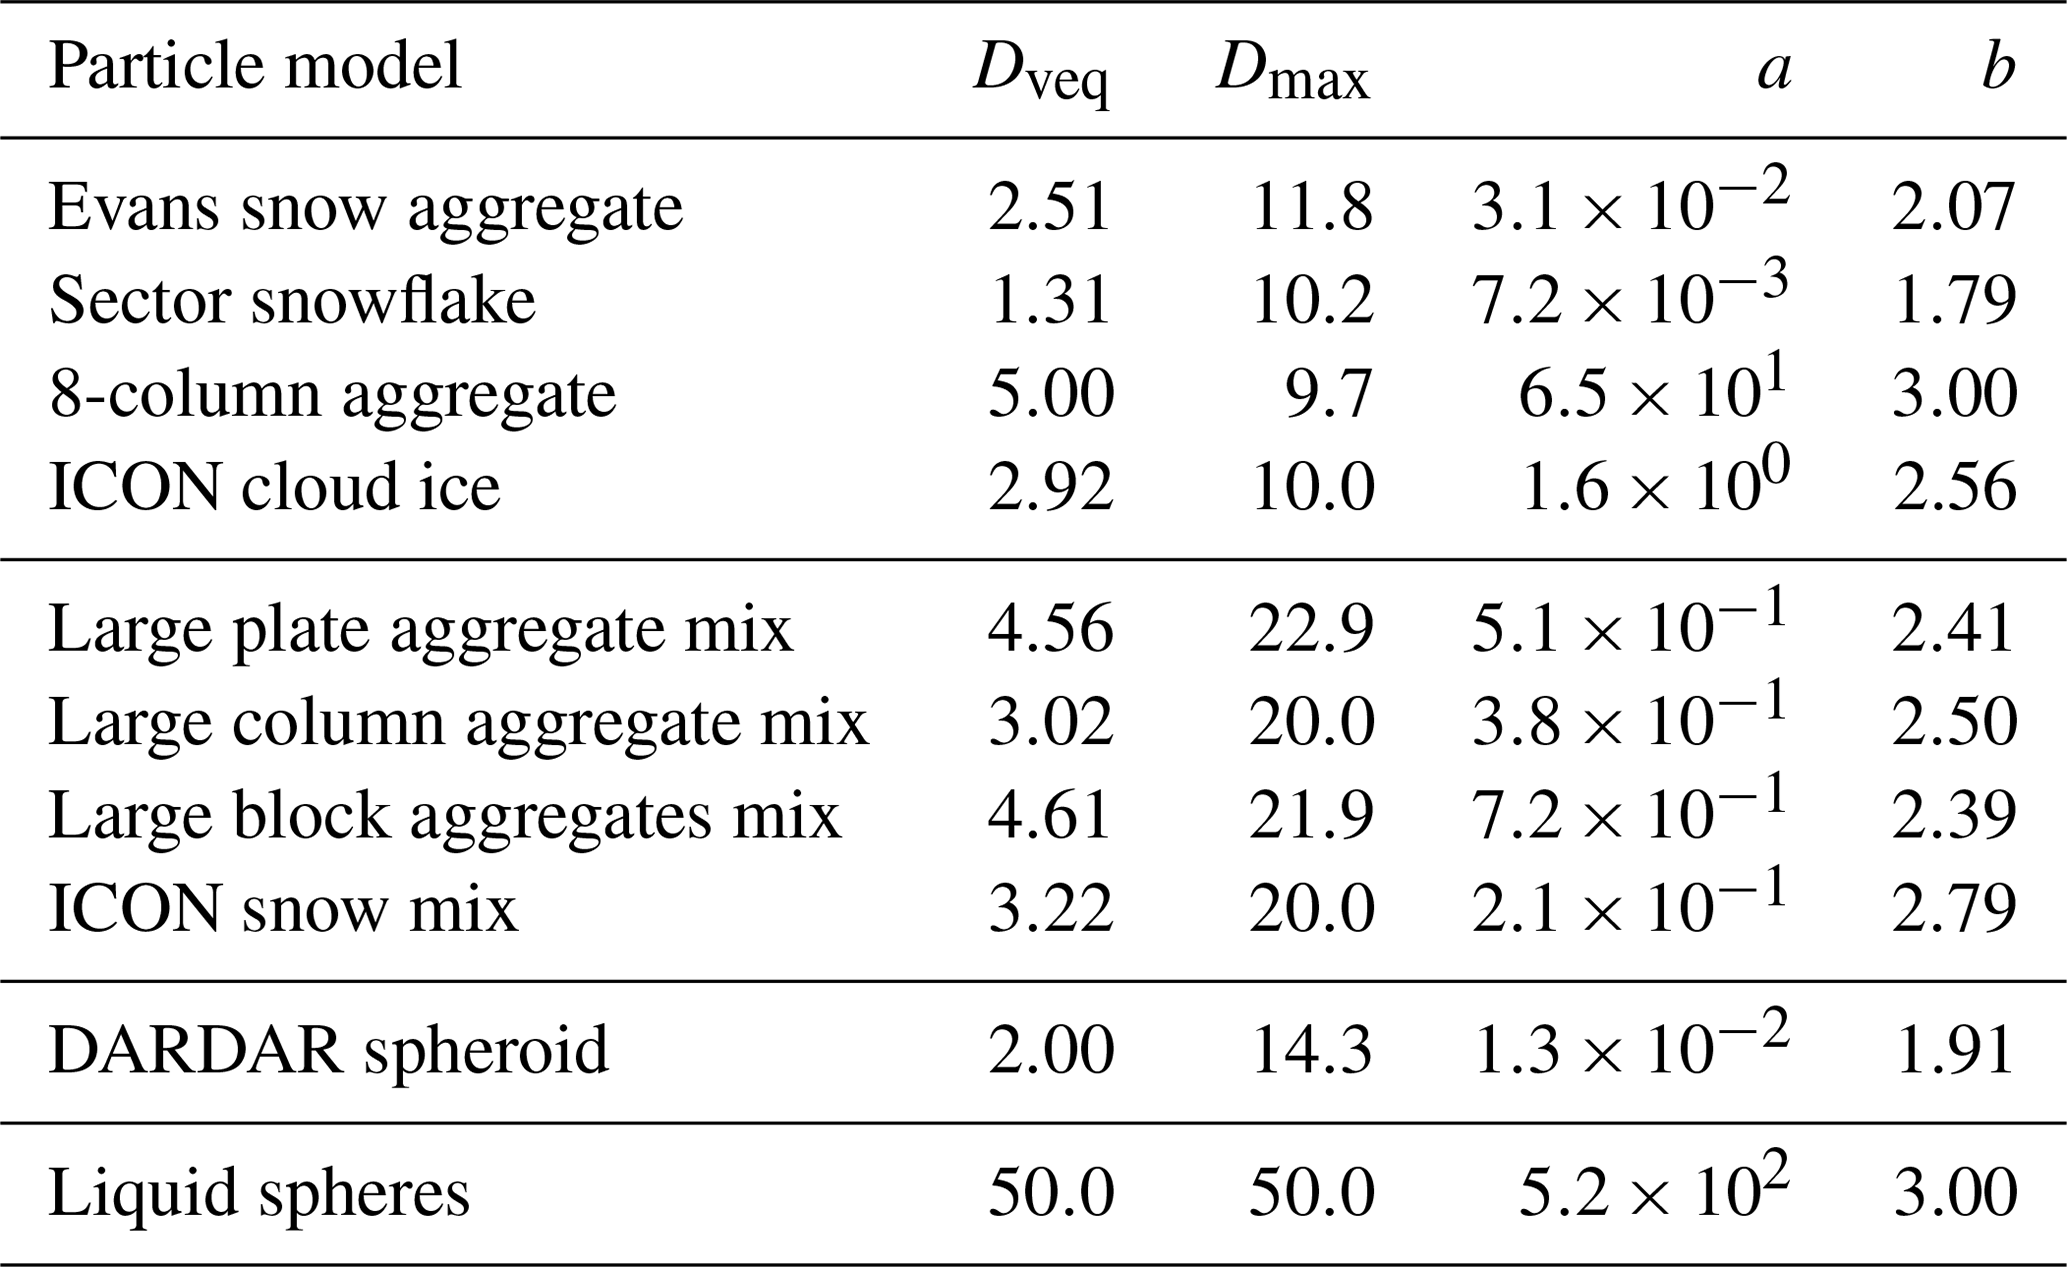
The particle models, or habits as they are also commonly called, selected for evaluation in this study are outlined in Table 1. A fundamental difference between the particle types is how the particle mass is related to the size as they grow. Traditionally, this relationship is described by a power law:
where m is the particle mass, Dmax the maximum diameter, and a and b the coefficients that are specific to the particle model. Table 1 lists values of a and b for each particle model, calculated by fitting a line to the mass–size relationship in logarithmic space; instances of Dmax below 200 µm are not included the calculations. Here, Dmax is defined as the diameter of the minimum circumsphere of the particle. Because some of the particle types do not cover broad enough size spans, there are also particle mixes available. Particle mixtures consist of pristine crystals at lower sizes and more complex particles like aggregates at larger sizes. There is a gradual shift in particle and scattering properties in a transition region in order to avoid discontinuities. The width and placement of the transition region differs between particle models but is roughly between 100 and 400 µm. Since the reported a and b values are calculated for particle mixtures, they differ somewhat to values reported in Eriksson et al. (2018). The database also includes scattering data for liquid spheres, calculated using Mie code, which will be used to describe scattering by rain.
A soft-spheroid particle is also included, whose scattering properties are calculated using T-matrix code by Mishchenko (2000). The particle is designed to mimic the settings applied in the DARDAR v2.1 product. In short, the spheroids are oblate with an aspect ratio (ratio of the minor to the major axis) of 0.6 and follow the mass–size relationship given in Delanoë et al. (2014, Eqs. 13–15). The refractive index of the particles is calculated using the Maxwell–Garnett mixing formula (Garnett, 1904) assuming an air-in-ice mixture. Eriksson et al. (2015) evaluated mixing rules in the context of soft-spheroid approximations and found that this mixing formula performs relatively good compared to discrete dipole approximation (DDA) data.
While Dmax is commonly used to characterize the size of particles, the volume-equivalent diameter Dveq will be used throughout in this study. It is equivalent to the particle mass, which is more related to IWC and is generally more connected to the microwave particle scattering properties than Dmax (Ekelund and Eriksson, 2019).
Table 1Summary of the particle models used. Given sizes are in millimetres and refer to the largest particle size of each model. Further details are found in the text.
In order to assist the evaluation of the impact of assumed particle type on resulting simulations presented later, an overview of the scattering properties of the included particle types is presented in Fig. 1, displaying the backscattering at 94.1 GHz and extinction at 190.31 and 668.2 GHz as a function of Dveq for all particle types used in panels (a), (b), and (c), respectively. Backscattering and extinction are given as cross section ratios in decibels using the 8-column aggregate as the reference. The 8-column aggregate therefore shows up as a horizontal line in all of the panels.
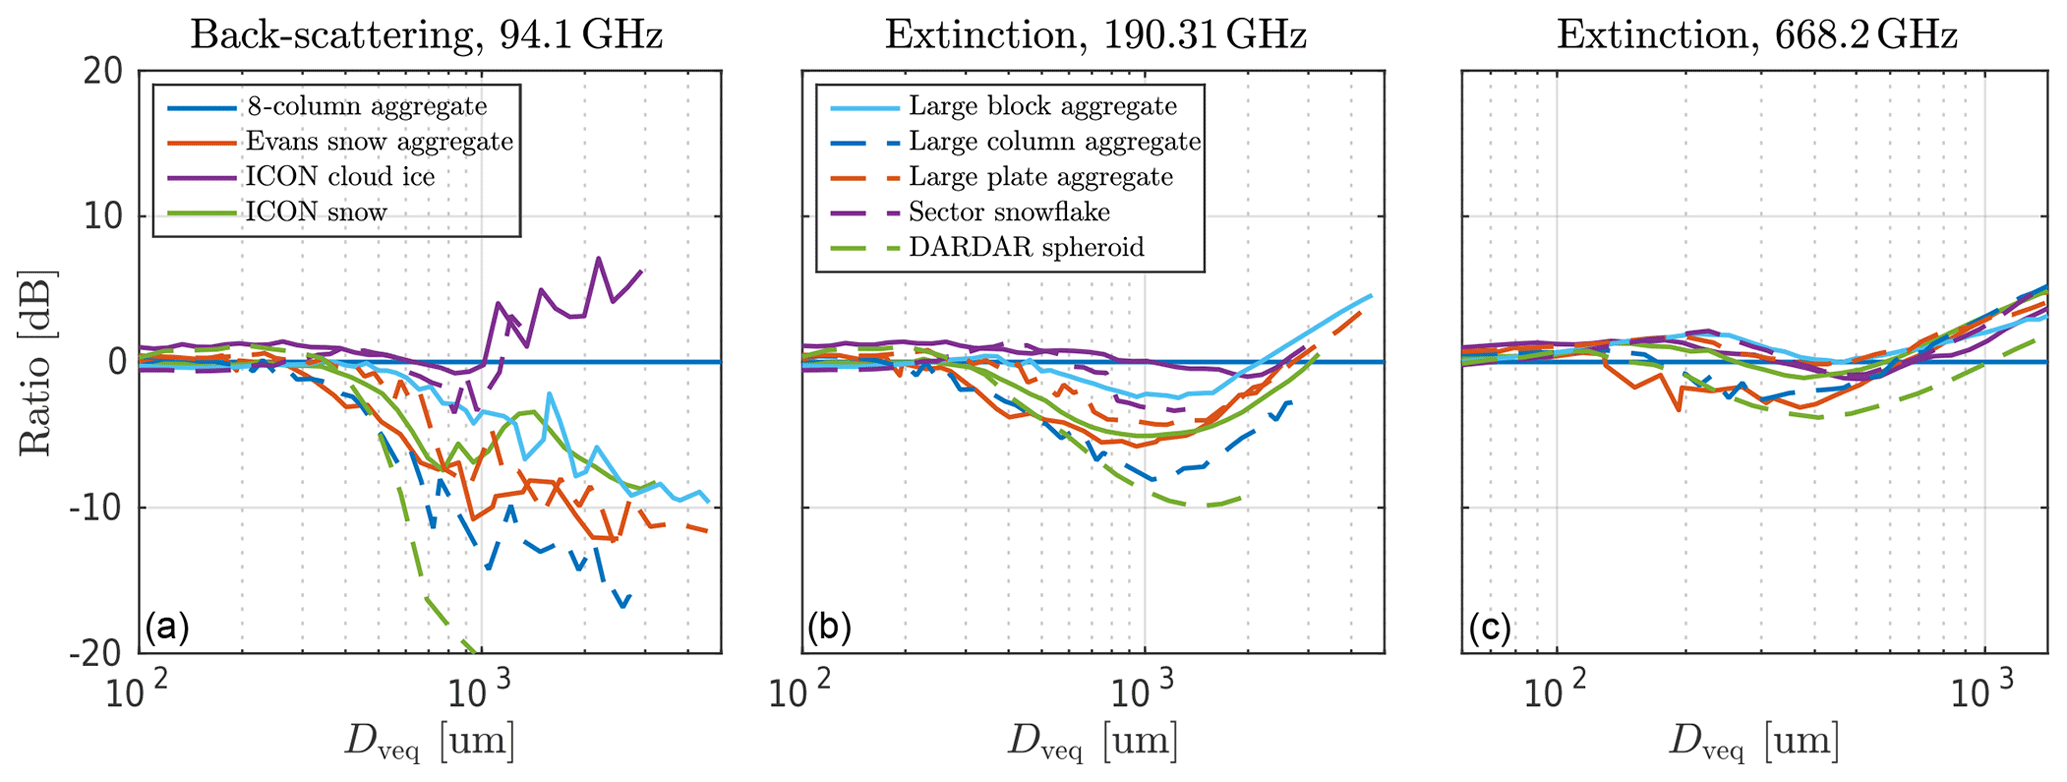
Figure 1Backscattering ratio at 94.1 GHz (a) and extinction ratio at 190.31 GHz (b) and 668.2 GHz (c) as a function of volume-equivalent diameter Dveq. Legends are common to all panels. The ratios are calculated as the cross section of a given particle model divided by the cross section of the 8-column aggregate and are given in decibels. That is, −3 dB means that the backscattering or extinction cross section is half of the Hong aggregate cross section. All data assume totally random particle orientation.
The ICON cloud ice, 8-column aggregate, and sector snowflake are found to be relatively efficient backscatterers, while the Evans snow aggregate, large column aggregate, and especially the DARDAR spheroid are relatively inefficient. The spread in backscattering is also enhanced as particle size increases. In Fig. 1b, the ordering of particle models in extinction is similar. For instance, the 8-column aggregate is a very efficient scatterer at both 94.1 and 190.31 GHz. However, the spread between the particles is lower in comparison to panel (a). At sizes above 1 mm the lines converge and the 8-column aggregate is gradually replaced by other particles as more efficient scatterers. At 668.2 GHz, the relative spread between particles is even more compact. Above 500 µm, most of the particles, except the DARDAR spheroid and the 8-column aggregate, have aggregated to a cluster of lines with a spread of approximately 2 dB.
2.7 Particle size distributions
The particle size distribution (PSD) describes, as its name suggests, how the particle sizes are distributed within a volume element. By integrating over all sizes, the particle number concentration is attained, while the particle mass density is attained by weighting with the particle mass. IWC is given by
where N describes the PSD and m is the mass of individual particles (in this study given by Eq. 1). Three different PSDs were selected for this study: two of them are commonly used by the passive community and the last one by the radar community. The first PSD by McFarquhar and Heymsfield (1997), denoted as MH97, has been used predominantly in studies related to limb microwave measurements (Davis et al., 2005; Wu et al., 2006; Eriksson et al., 2007; Rydberg et al., 2009). In situ data were collected from the Central Equatorial Pacific Experiment (CEPEX). They should mainly be considered valid for anvil cirrus in the tropics. Consequently, MH97 places relatively low weight on large particles and is therefore less suitable for snow, for instance. In contrast to many other PSD parameterizations, MH97 makes use of the volume-equivalent (mass-equivalent) diameter Dveq as the size descriptor. The MH97 PSD is therefore mass-conserving; i.e. the PSD-integrated mass does not depend on the mass–size relationship of the particle model.
The second PSD used here was developed by Field et al. (2007) and is denoted as F07. F07 and its predecessors have arguably seen more widespread use compared to MH97 (Kulie et al., 2010; Geer and Baordo, 2014; Fox et al., 2019). F07 is a single-moment PSD parameterization based on in situ PSD data compiled from multiple measurement campaigns. As input it requires the temperature and the mass–size relationship (Eq. 1) of the employed particle model, and it also has two different settings for mid-latitude and tropical conditions. Here, only the tropical setting is used, denoted as F07T. It uses Dmax as the size descriptor and is therefore not mass-conserving with respect to the assumed particle model.
The PSD used by the DARDAR v2.1 product is employed as well in order to provide insight into this specific product. It is described in Delanoë et al. (2014) and is referred to as D14. It is a modified gamma distribution fitted to in situ data. As such, the same αF and βF coefficients used in DARDAR version 2 are used for this study (Cazenave et al., 2019) ( and βF=4). As is the case for MH97, this PSD takes Dveq as input and is mass-conserving. Also, the PSD requires two moments as input, the normalized number concentration parameter and the mean volume-weighted diameter Dm. Any of these parameters can be interchanged with IWC through conversion, so only IWC and are used in this study. Since the radar inversion algorithm, described later in Sect. 3.2, only retrieves IWC and not , an a priori parameterization of is used instead. The parameterization, described in Delanoë et al. (2014), takes temperature as input and is defined as
where and a=17.948 are coefficients fitted to aircraft in situ measurements, and T is the temperature given in degrees Celsius.
For describing rain, the PSD by Wang et al. (2016) was selected. It is described by a gamma function based on aircraft in situ measurements of multiple convective cores in North Dakota, USA.
The impact of the assumed PSD will be investigated later, and an overview of the PSDs used is therefore given in Fig. 2. The panels show the PSD-weighted extinction cross section of the ICON cloud ice particle using the PSDs of MH97, F07T, and D14, in panels (a), (b), and (c), respectively. Different values of IWC are assumed in the coloured lines, and the distributions have been normalized to have an area equal to 10−3. Generally, the PSDs produce mostly small particles, with diameters of roughly 10 µm. However, Fig. 2 shows that in terms of scattering impact, intermediately sized particles (300 to 1000 µm) dominate. Of the investigated PSDs, MH97 puts the highest emphasis on small particles, with two modes being clearly visible for an IWC of 10 mg m−3. There is little change as IWC increases, apart from the first mode becoming less pronounced. F07T and D14 are fairly similar to each other, both resulting in a stronger emphasis on larger particles compared to MH97 at increasing values of IWC.
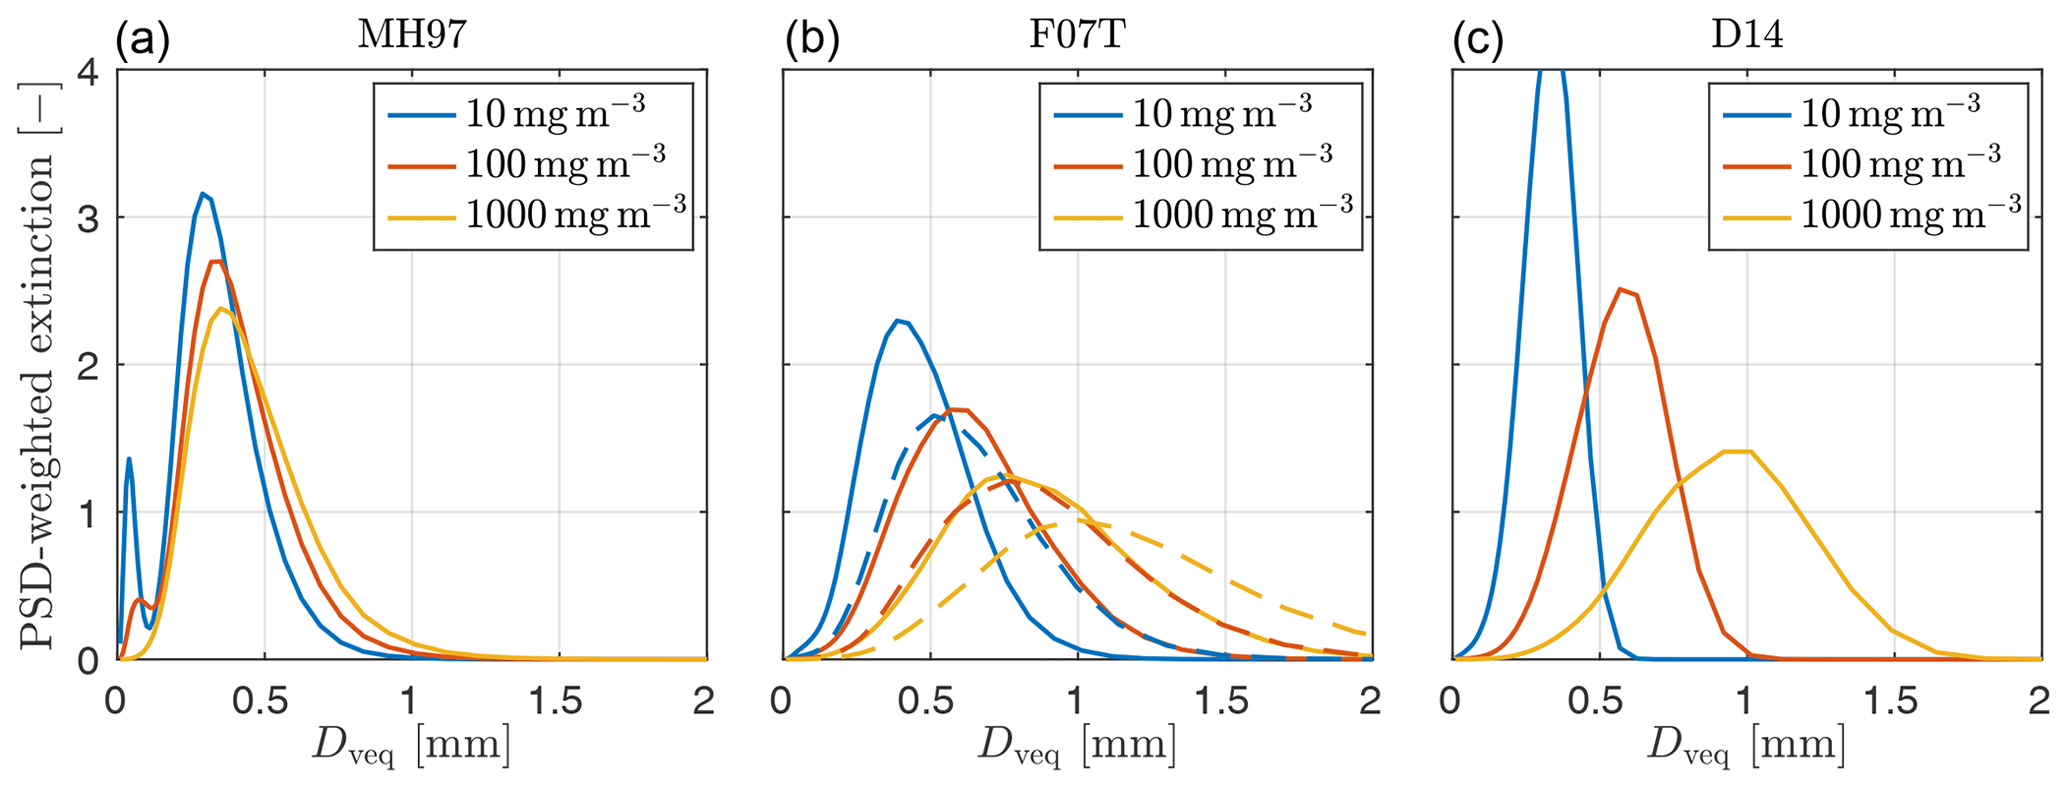
Figure 2Normalized extinction as a function of volume-equivalent diameter Dveq for different combinations of particle size distribution and IWC. Frequency is 190.31 GHz, temperature 255 K, and the assumed particle model is the ICON cloud ice. Each extinction curve is normalized to have an area equal to 10−3. (b) Extinction calculated using the 8-column aggregate is included, indicated by dashed lines, for comparison.
As a final comment, the F07 PSD requires the mass–size relationship coefficients as input (a and b in Table 1). For comparison, the 8-column aggregate is included, indicated by dashed lines, in panel (b). This particle model has a value of b=3, resulting in a shift of the distributions towards higher values of Dveq. Hence, comparisons between F07 and other PSDs are generally not straightforward but depend on the assumed particle model.
This section describes the employed modelling system, which simulates passive satellite observations of clouds based on CloudSat radar measurements. There are two variants or modes of this system, denoted IWC-based and dBZ-based, and they are both schematically described in Fig. 3. The overall idea is to perform RT simulations on synthetic scenes using different microphysical assumptions in order to evaluate their impact on measurements and performance in relation to GMI. These assumptions are realized as different combinations of particle models (nine in total; see Table 1) and PSDs (three in total; see Sect. 2.7). The synthetic scenes are created using data outlined in Sect. 2, and their generation is described in Sect. 3.1. Forward simulations mimicking GMI and ICI are then performed at selected frequencies. These simulations are then compared to GMI measurements statistically. Simulations at ICI frequencies are performed in order to investigate the potential of using ICI in the same way in the future.
The two model modes differ in how the input IWC field is set in the forward model. The first mode (marked in blue in Fig. 3) makes use of the DARDAR IWC product, invariant to the microphysical assumptions used in the forward model. The purpose of this mode is mainly to indicate the importance of correct microphysical assumptions in situations in which IWC is already set or known. The second mode (marked in red in Fig. 3) takes CloudSat reflectivities and converts them to IWC fields using an onion-peeling retrieval method (described in Sect. 3.2), with microphysical assumptions consistent with those used in the forward simulation. This mode is used to constrain possible particle and size distribution combinations, forcing them to be consistent for both passive (GMI) and active (CloudSat) observations.

Figure 3Flowchart describing the active and passive modelling system. White boxes and black arrows represent processes and data common to both variants of the system. The blue box and arrow are part of the IWC-based system; i.e. simulated TBs are generated using DARDAR IWC as input. The red boxes and arrows, on the other hand, describe the dBZ-based model system, for which the forward simulations use CloudSat reflectivities as input. As indicated by the red arrows from the PSD and SSP (single scattering properties) boxes, the dBZ-based system assumes the same microphysics for both the radar inversion and the consequential forward simulation.
There are a number of limitations to this study that should be noted. Firstly, it is assumed that the orientation of all particles is completely random. The ARTS database currently does not provide scattering data for oriented particles, and there are no appropriate alternative databases that do. Secondly, for a given simulation, only a single ice particle type is assumed for the whole scene; i.e. ice particle types for different cloud or precipitation types (e.g. cirrus or snow) are the same within a given simulation. Thirdly, comparisons of real and simulated observations using collocated datasets would have been ideal. However, because the number of collocations between CloudSat and GMI is limited around the Equator (Rysman et al., 2018; Yin and Liu, 2019) and the different observation geometries present difficulties, the statistical approach was selected instead.
3.1 Generating synthetic scenes
The synthetic scenes are defined on two-dimensional grids in latitude and pressure, using CloudSat measurements as a reference. Extracted data are restricted to a rectangular geographic area in the Pacific Ocean, within 20∘ S to 20∘ N and 170∘ E to 130∘ W. The pressure grid is defined up to 42 hPa, and the latitude grid is resolved in steps of roughly 0.01∘. The time frame of the scenes was selected with the purpose of getting the best possible match between CloudSat measurements and GMI measurements. CloudSat passes the Equator in the Pacific Ocean during daytime at roughly 13:30. Since GPM has a non-sun-synchronous orbit, a day in 2015 when GPM passes the Equator at roughly the same time could be identified and selected as the reference day. A time frame of 30 d centred around this reference day was then set, from which 59 CloudSat overpasses could be identified within the geographic area and selected as references for the synthetic scenes. From this time frame, all available GMI data within the defined geographical area were extracted for comparison to the forward simulations. While the extracted CloudSat and GMI data are not collocated, they are extracted from the same geographic area in the same month and were collected at roughly the same time of the day (within ±4 h). As a consequence, a much larger dataset can be considered than if only collocations were to be considered.
As mentioned in the previous section, the synthetic scenes are composites of data collected form several sources. Atmospheric fields of temperature, humidity, CWC, surface temperature, and elevation are collected from ERA-Interim (see Sect. 2.4). In the IWC-based mode, IWC fields from DARDAR are employed as an input, while in the dBZ-based mode CloudSat retrievals (described in Sect. 3.2) are set as the input, which are converted to IWC fields using microphysical assumptions consistent with the forward simulations (see Fig. 3). Rainwater content (RWC) fields are retrieved from CloudSat reflectivities for both modelling systems, since RWC is not provided by DARDAR. All fields are interpolated onto the aforementioned pressure and latitude grid.
Some modifications to the data provided by ERA-Interim are performed. Relative humidity is set to 0.9 at locations with water content above 50 µg m−3 in order to ensure that humidity is not artificially too low or high at locations with clouds or precipitation. Liquid water content is also adjusted. It is set to zero at altitudes higher than 10 km and at temperatures lower than 243 K. Furthermore, for pixels at which IWC or RWC is zero, CWC is set to zero as well. This ensures that ERA-Interim does not place liquid water outside clouds and precipitation detected by CloudSat.
3.2 Radar inversions
A brief description of the radar inversions is given here. First of all, for a given particle and PSD combination the effective radar reflectivity Ze at frequency ν is given as
where σb is the backscattering cross section and K=0.75 the dielectric factor; it is set to the value used by CloudSat (Stephens et al., 2008). Following convention, the reflectivity is shown in decibels relative to the equivalent reflectivity (dBZ), i.e. 10log 10(Ze). For all microphysical combinations, reflectivities are calculated on an IWC grid and stored in IWC–dBZ tables. At temperatures above 0∘, the same formula is applied assuming rain instead, for which a separate RWC–dBZ table is constructed. Radar inversions are then performed for each microphysical combination. An onion-peeling concept is used, implying that the atmosphere is divided into layers. The IWC value of the top layer is extracted from the IWC–dBZ table given the measured CloudSat reflectivity at that layer. The two-way radar attenuation of this layer is then calculated, taking the updated IWC (or RWC) value into account. The CloudSat reflectivity of the layer below is then updated to account for the radar attenuation. The maximum correction in decibels is set to 3 in order to account for reflectivity enhancement due to multiple scattering (Battaglia and Simmer, 2008). The IWC and RWC grids are thus calculated iteratively by taking the radar attenuation of above layers into account. Absorption by gases and liquid clouds is considered in the same manner as in the forward simulations, as described in the next section.
3.3 ARTS setup
This section describes the forward simulations and the ARTS settings used. The RT simulations are two-dimensional but approximated using the independent beam approximation; i.e. one-dimensional calculations are performed along the line of sight of the simulated sensors. Polarization effects are neglected, since randomly oriented single scattering will not have a strong effect on polarization. Hence, only the first Stokes element is simulated. All simulations are performed at an earth surface incidence angle of 53∘, close to the angles used by ICI and the GMI channels mimicked in this study. The simulated frequencies are 166, 186.31, 190.31, 328.65, 334.65, and 668.2 GHz. As this study is of a demonstrative nature, the lower GMI channels are omitted, since these are less sensitive to cloud ice. We also limit the number of covered ICI channels. The antenna pattern of GMI and ICI is approximated post-simulation by averaging over multiple pencil beams assuming a Gaussian footprint pattern with a full width at half maximum of 6 (166, 186.31, and 190.31 GHz) and 15 km (328.65, 334.65, and 668.2 GHz), respectively. Oxygen and water vapour absorption are calculated using the PWR-98 model by Rosenkranz (1998) and nitrogen absorption using the standard profile by Liebe et al. (1993). Furthermore, liquid clouds are treated using the absorption model by Ellison (2007) (scattering by liquid clouds is omitted).
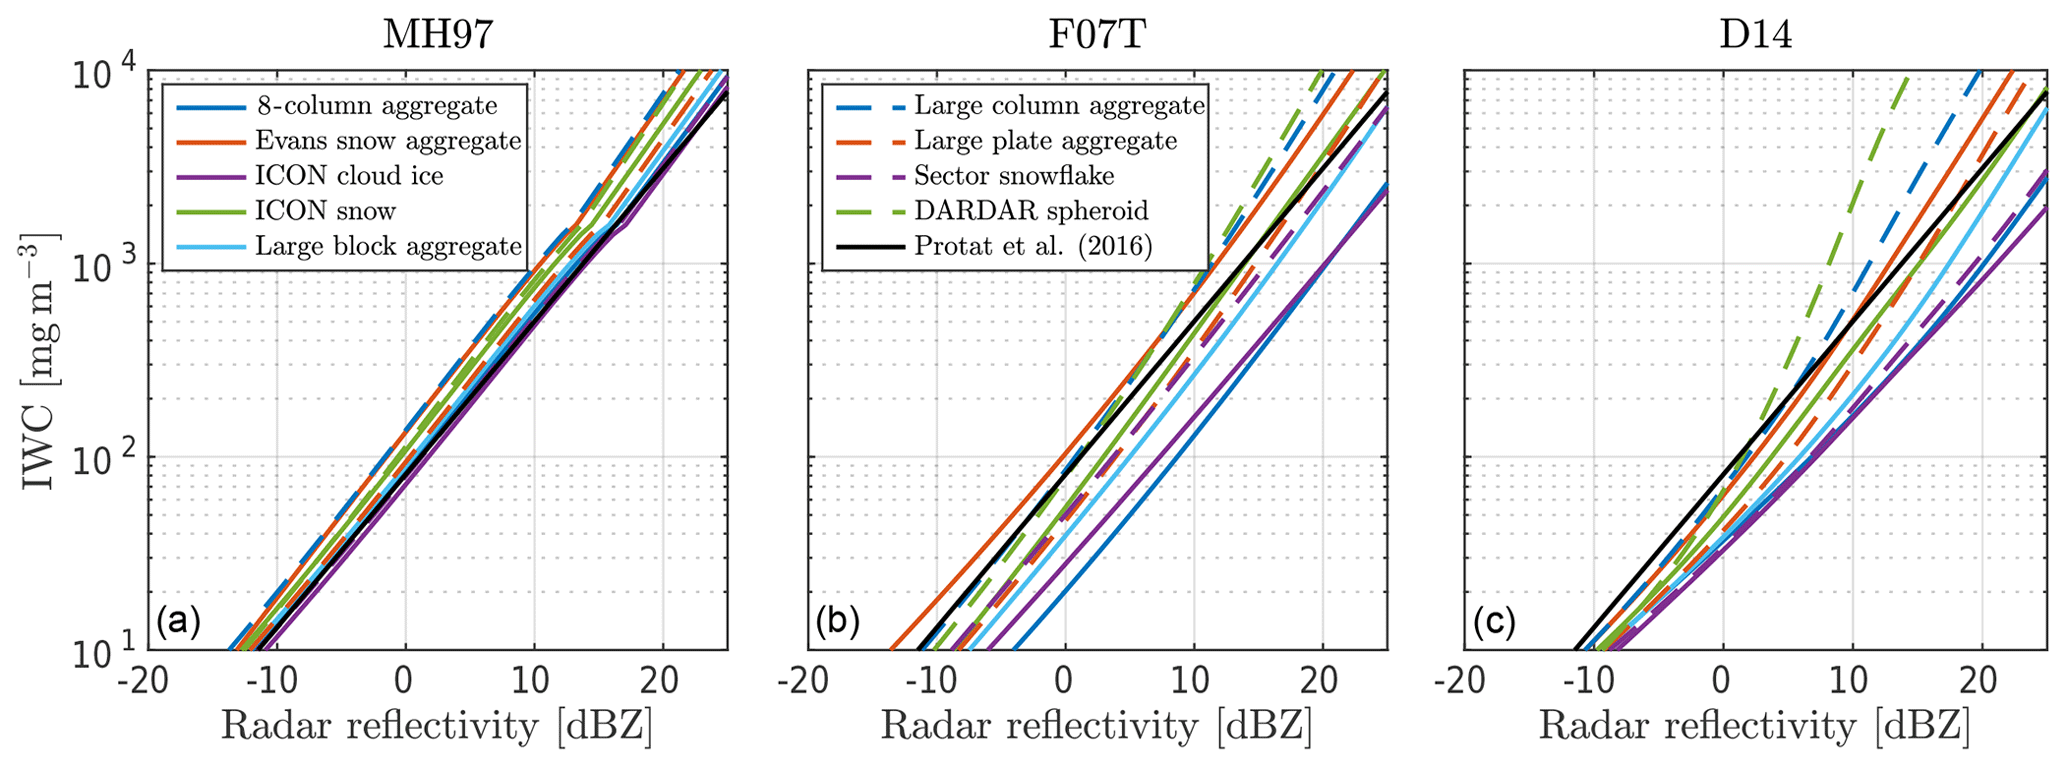
Figure 4Radar reflectivity and IWC relationships at 255 K. The coloured curves are the relationships obtained by combining the particle models in Table 1 with the particle size distributions of MH97 (a), F07T (b), and D14 (c). The black lines represent the IWC–dBZ relationship taken from Protat et al. (2016).
4.1 CloudSat inversions
This section gives an overview of the CloudSat radar inversions. The radar IWC tables are first presented, then retrieved ice water path (IWP) for an example scene is shown. Finally, IWC and IWP across all scenes are overviewed statistically.
4.1.1 IWC–dBZ relationships
Figure 4 overviews calculated relationships between radar reflectivity and IWC, which are used for the CloudSat inversions described in Sect. 3.2. Panel (a) uses the MH97 PSD, panel (b) F07T, and panel (c) D14. For MH97, the spread of the lines is relatively small, roughly a factor of 2, since the PSD puts high emphasis on smaller particles for which the spread in backscattering is less significant (see Fig. 1a). Conversely, F07T results in a large spread of the lines, almost a full order of magnitude. In other words, F07T results in a higher uncertainty in IWC for a given reflectivity value with respect to the assumed particle type. In contrast to MH97 and F07T, D14 displays a more gradual increase in spread. At low reflectivity values, the spread is fairly small, while for large values the spread is comparable to that of F07T. As shown in Fig. 2, D14 emphasizes smaller particles at low values of IWC, similar to MH97. At higher IWC values, the PSD behaves more like F07T, explaining the gradual increase in spread.
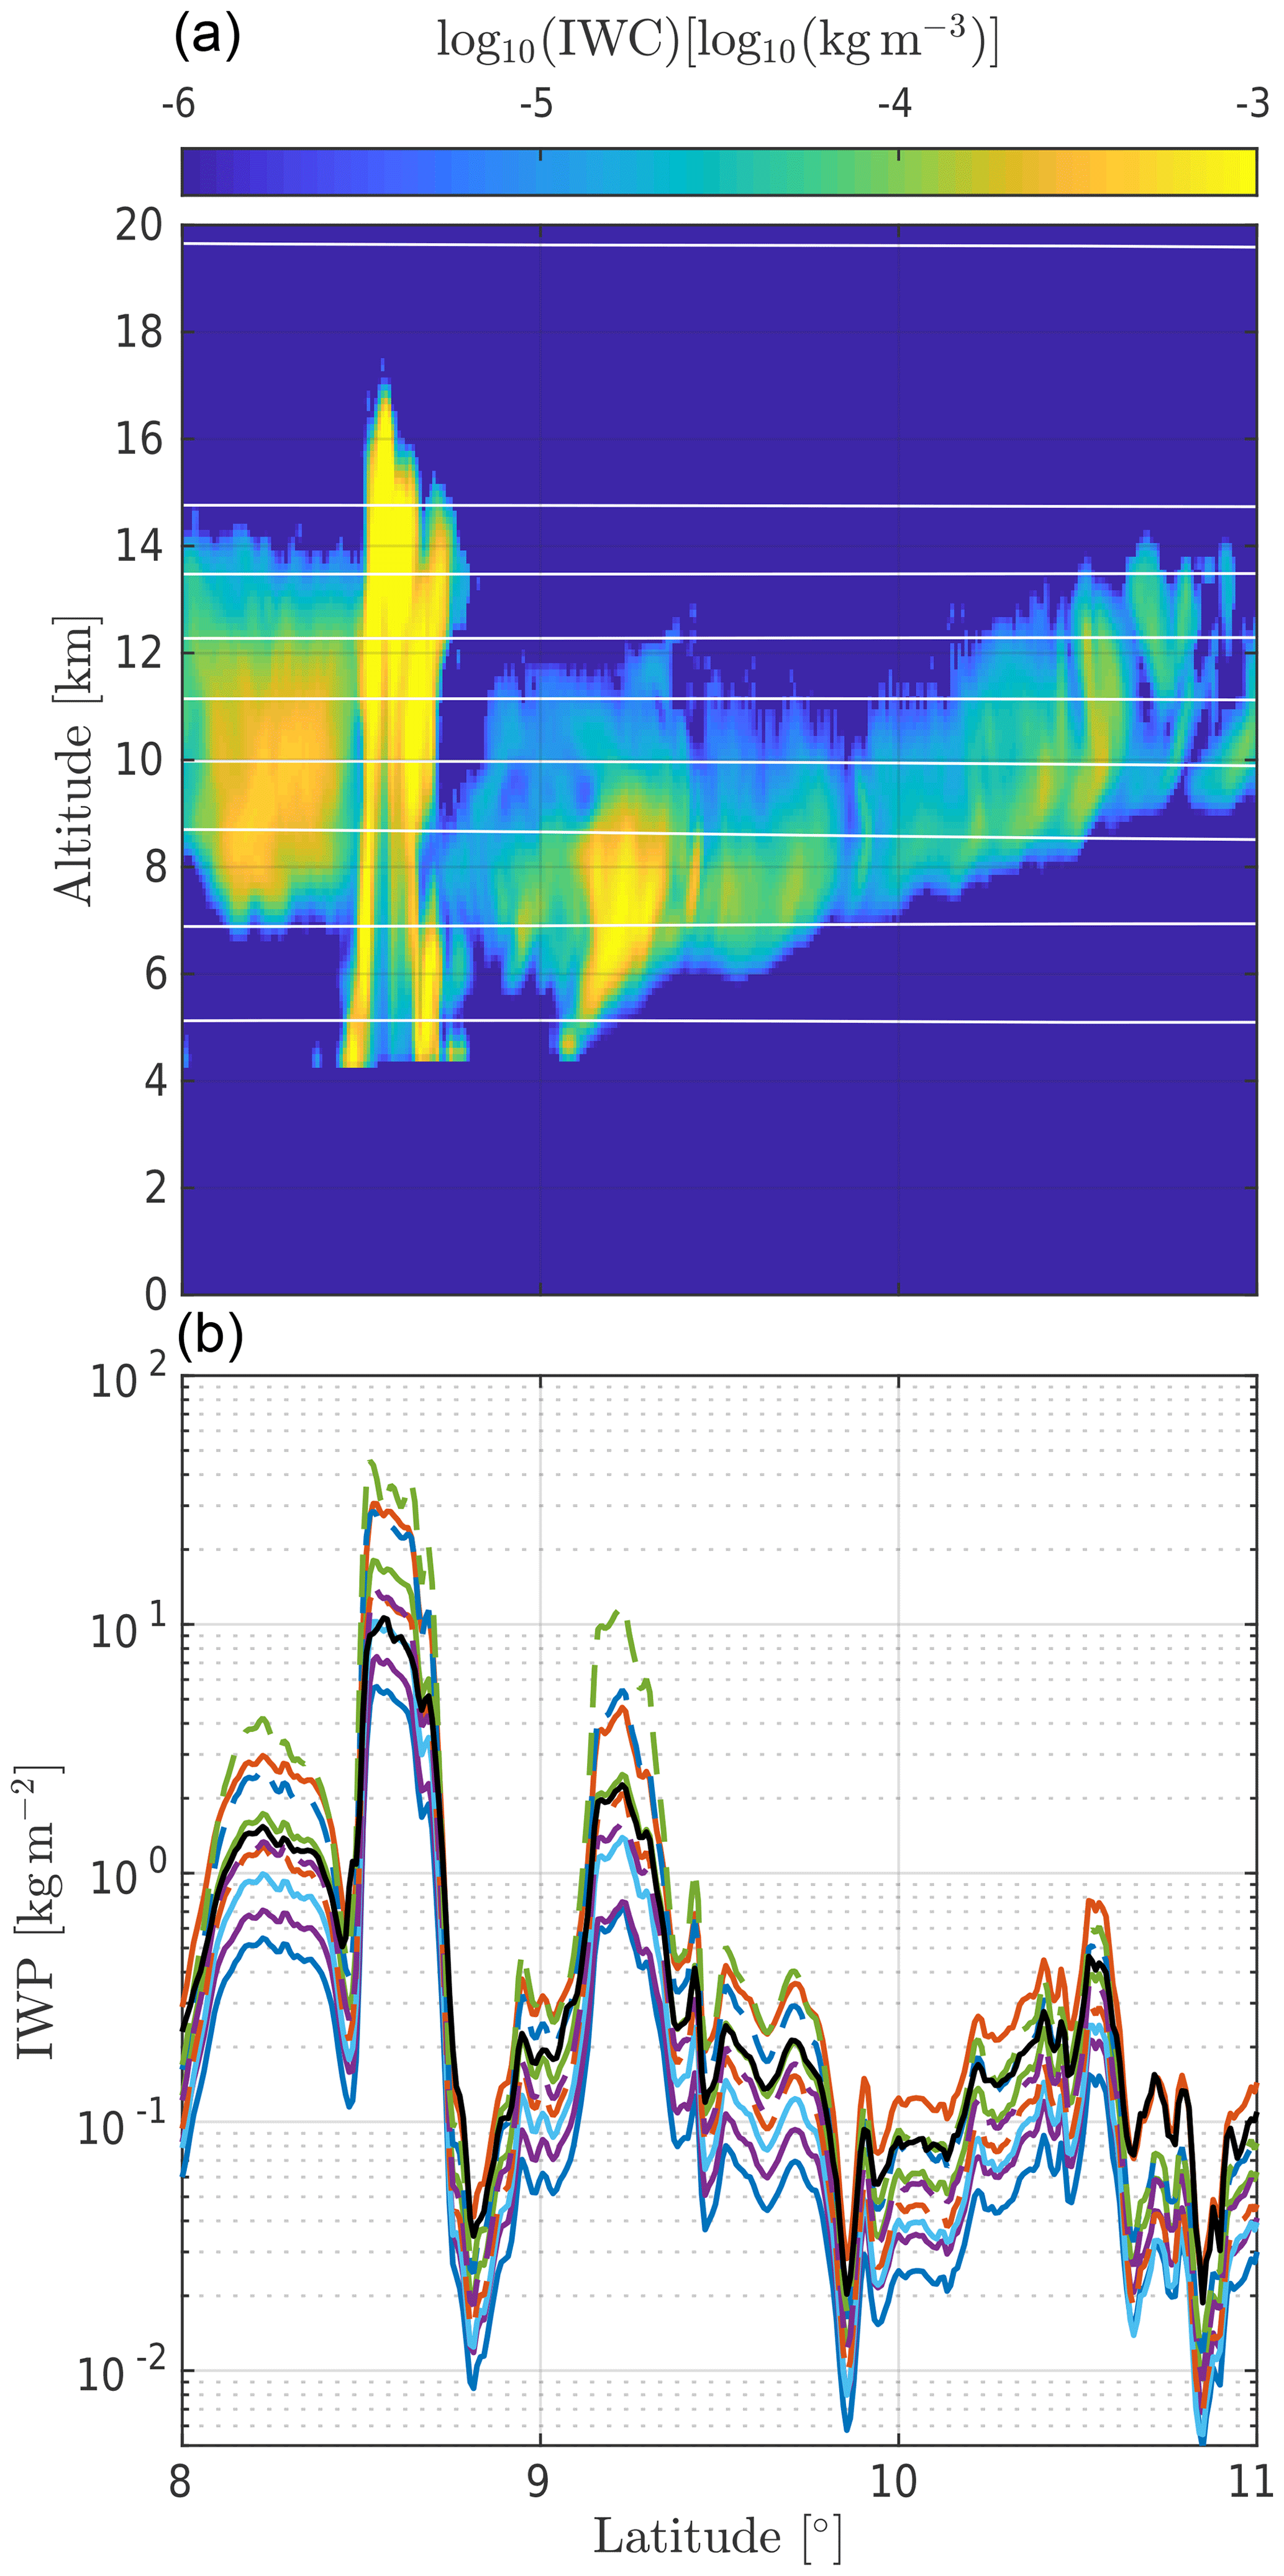
Figure 5Example scene with a deep convective core and some medium- to high-altitude ice clouds. (a) DARDAR IWC field and temperature contour lines, going from 270 to 200 K, in steps of 10 K. (b) Ice water path. The black line represents the DARDAR product IWP, while the coloured lines are from radar inversions assuming different particle types, as indicated by the line colour. See the legends in Fig. 6 for a full description of the lines. F07T is the assumed PSD for all the coloured lines in this figure.
Also included is the radar reflectivity relationship developed by Protat et al. (2016, Eqs. 3–5), which is based on collocated airborne radar and in situ measurements of deep convective systems in the northern part of Australia. Calculated relationships cover the Protat line fairly well, though MH97 tends to underestimate reflectivity values in comparison. However, this is expected; since the relationship by Protat is empirical, it is to some degree influenced by azimuthally oriented particles. Azimuthal alignment enhances nadir or zenith backscattering (Hogan et al., 2012); hence, it is expected that the calculated reflectivities are underestimated by a few decibels in comparison to Protat. Also note that the slopes of the MH97 and Protat radar relationships are almost the same.
4.1.2 Example scene
Figure 5 overviews an example scene containing several cloud types, including a deep convective core and some cirrus. Panel (a) shows the DARDAR IWC field and the bottom IWP, defined as column-integrated IWC. The coloured lines represent IWP from radar inversions as described in Sect. 3.2 (the colours are the same as in Fig. 4 and 6), and the black line is IWP derived from the DARDAR product. The spread in IWP between different particles is almost an order of magnitude. The ordering of the lines is explained by Fig. 4b. For instance, the 8-column aggregate (dark blue full line), a relatively efficient scatterer, is mapped to a low IWC value for a given measured reflectivity value, resulting in relatively low IWP overall. Conversely, the Evans snow aggregate (orange full line) is mapped to high IWC values, resulting in considerably higher IWP.
The retrieved IWP values cover the DARDAR IWP fairly well, though no particle type gives consistent agreement. The large block aggregate gives good agreement at the convective core, while the Evans snow aggregate gives better agreement at lower IWP values.
4.1.3 Mean IWC distributions
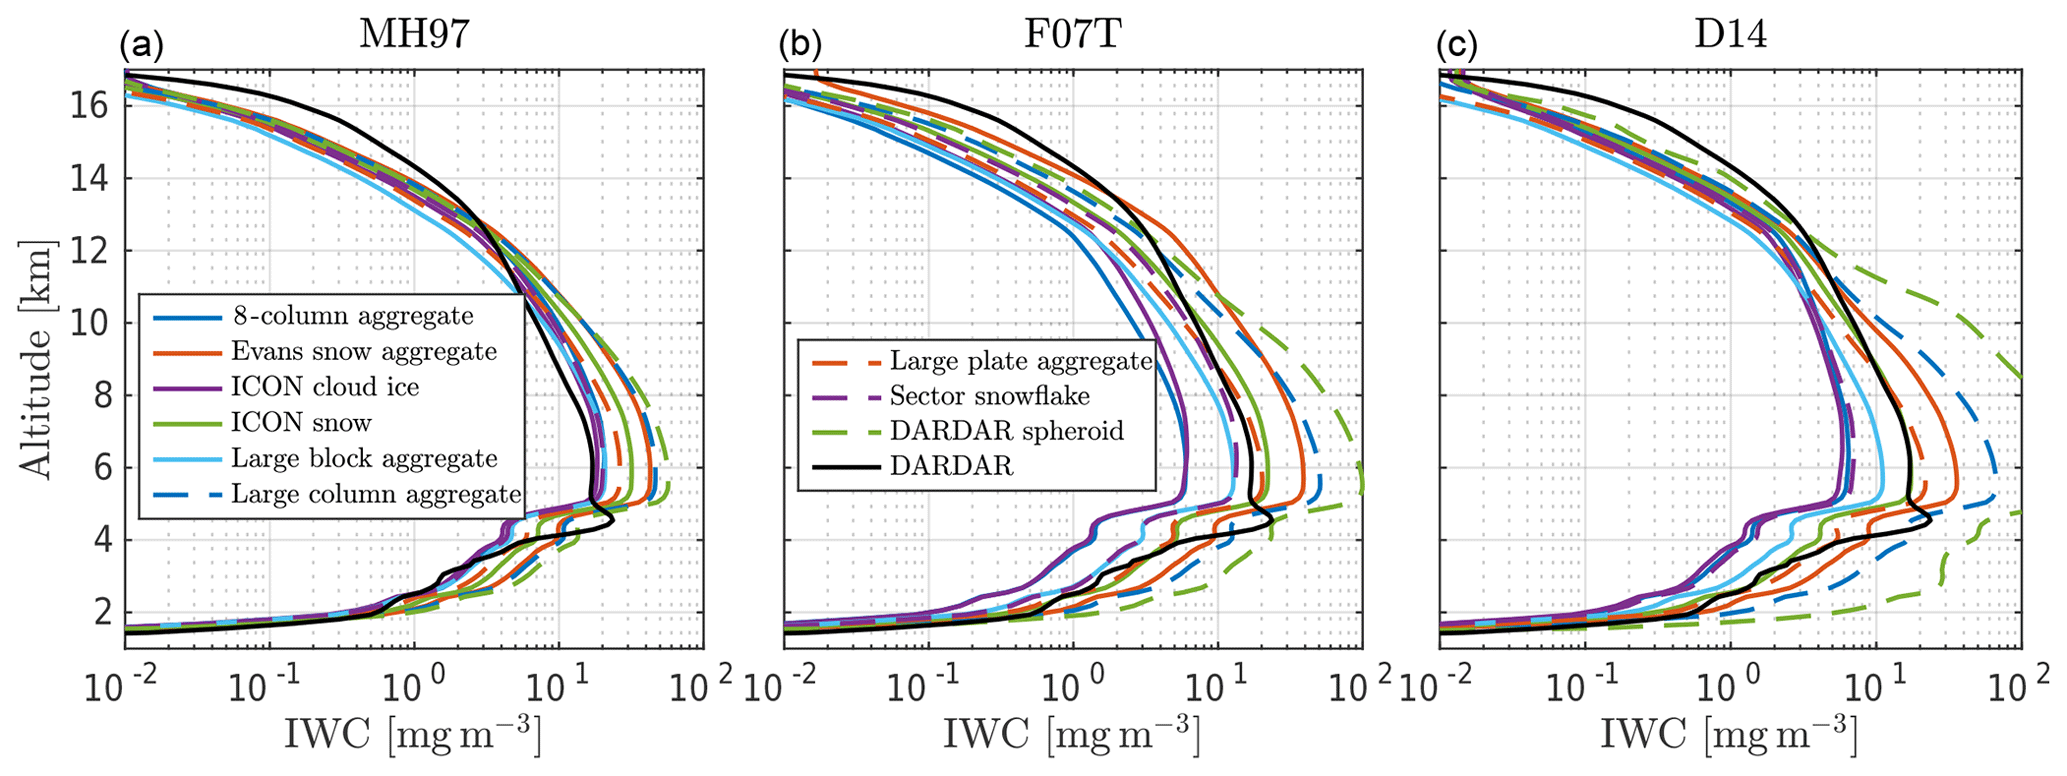
Figure 6 shows the mean retrieved IWC for the different particle types as a function of altitude. The IWC means are derived by averaging the IWC fields, including data from all simulated scenes. Panel (a) uses MH97, panel (b) F07T, and panel (c) D14. The DARDAR IWP is included as a the black line in all panels.
There is a clear difference between the PSDs. MH97 is found to have lower sensitivity to the assumed particle type. At an altitude of 5 km, where the highest amount of ice is found and the uncertainty is the largest, spread is roughly a factor of 3 for MH97 and over an order of magnitude for F07T. However, the lines of the particles are ordered in roughly the same way for both PSDs. The D14 PSD shows similar tendencies as F07T. The exception is the DARDAR spheroid, which yields noticeably higher values of IWC between 5 and 10 km compared to F07T.
In comparison to the DARDAR IWC, all PSDs seem to underestimate IWC at altitudes above 12 km. The CALIPSO lidar is not included in the inversions, and the CPR is not sensitive to thin ice clouds; hence, the inversions put excessively low IWC at high altitudes. This is also demonstrated in Fig. 5, wherein retrieved IWP is consistently lower in comparison to DARDAR for clouds with less than 1 kg m−2. Between 5 and 10 km, MH97 tends toward higher IWC compared to DARDAR. F07T and D14, on the other hand, cover the DARDAR line fairly well at these altitudes. For both F07T and D14, the large plate aggregate and ICON snow lie close to the DARDAR IWC.
4.2 Simulated GMI observations
This section overviews the simulated measurements of TB. First, bulk extinction coefficients are overviewed, which is useful for the interpretation of simulated TBs. TBs are then shown for the same example scene as presented in Sect. 4.1.2. Finally, simulated TBs are analysed statistically, including the results from all simulated scenes.
4.2.1 Bulk extinction
Bulk extinction is shown in Fig. 7 as a function of either IWC (panel a) or radar reflectivity (panels b and c). Extinction is shown in terms of extinction coefficient ratios, i.e. γext of given particle divided by γext of a reference particle: in this case the 8-column aggregate. The extinction coefficient is given by
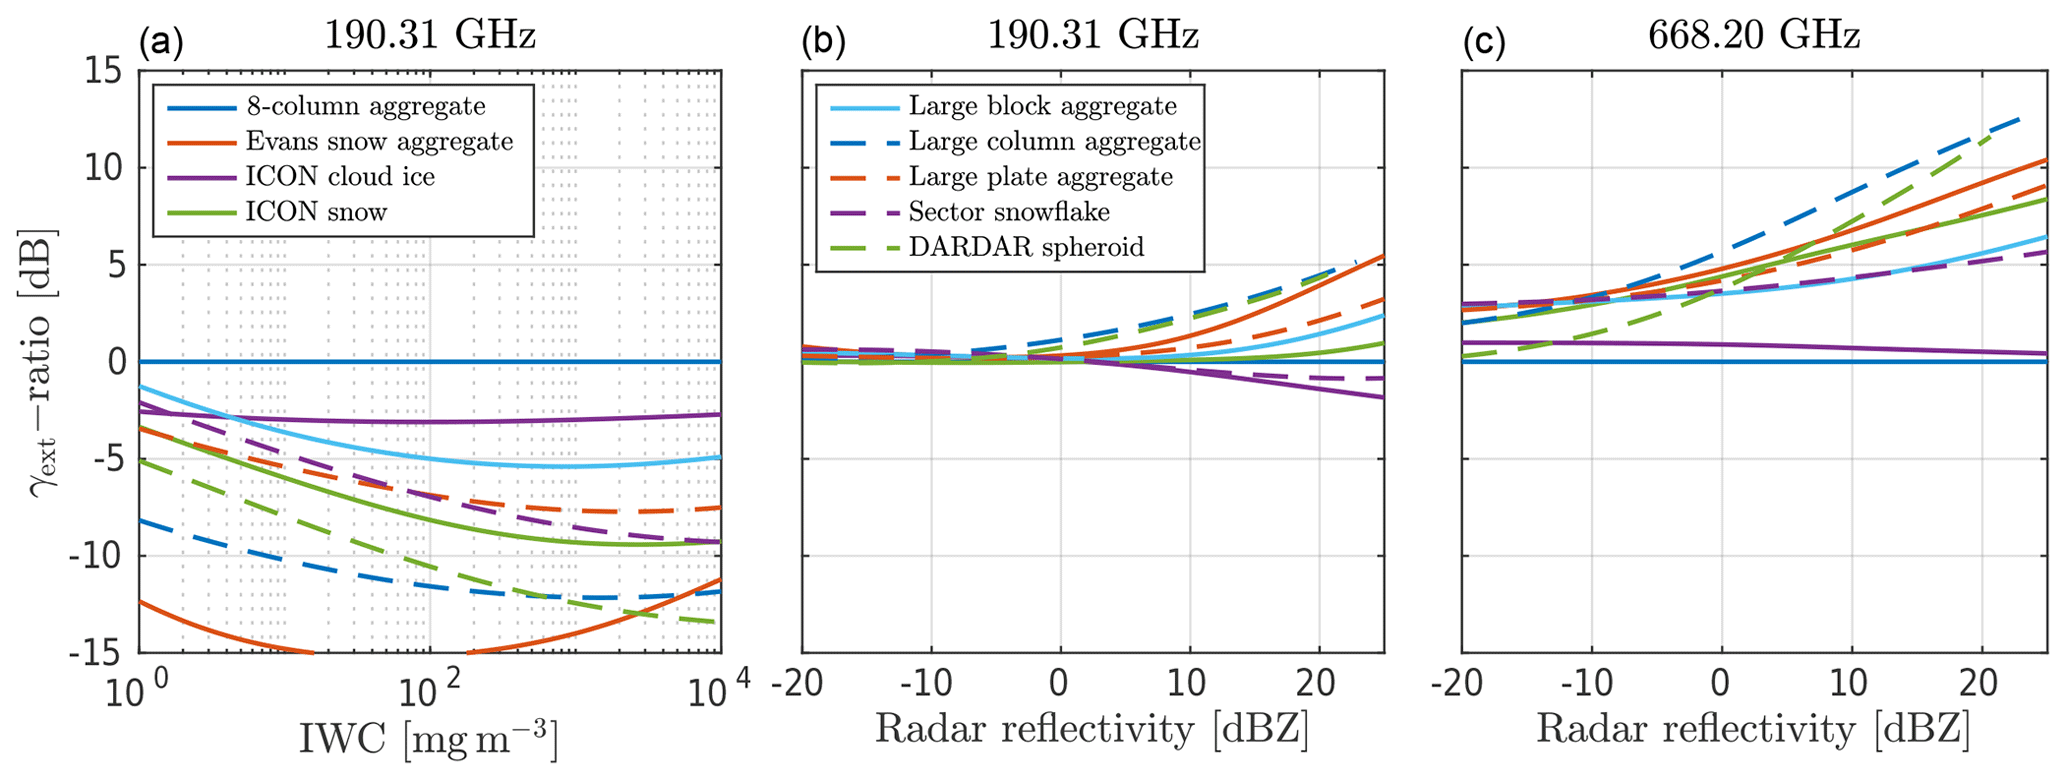
Figure 7Ratios of the extinction coefficient γext as a function of IWC (a) and radar reflectivity (b, c). The ratios are calculated by dividing γext of given particle model by γext of the 8-column aggregate. Hence, the 8-column aggregate appears as a straight line. The frequencies are 190.31 GHz (a, b) and 668.2 GHz (c). PSD is F07T, and temperature is 255 K.
where σe is the extinction cross section. The frequency is 190.31 GHz in panels (a) and (b), and it is 668.2 GHz in panel (c). PSD is F07T in all panels, and the assumed temperature is 255 K. The spread between particle models in panel (a) is large, over 10 dB, implying that simulated TBs are indeed highly dependant upon the assumed particle model (in the IWC retrieval). On the other hand, there is a clear reduction in spread in panel (b), where extinction is expressed in terms of radar reflectivity. This will partly explain the results shown in the next sections. In panel (c), the frequency is 668.2 GHz instead. The spread is slightly larger, with the 8-column aggregate, ICON cloud ice, and DARDAR spheroid particles standing out. The extinction coefficient γext as a function of IWC at 668.2 GHz (not shown here) behaves fairly similar compared to the lines in panel (a).
4.2.2 Example scene
Simulated TBs are presented here for the example scene shown in Fig. 5. In Fig. 8, simulations at 190.31 GHz for different combinations of PSD, particle type, and modelling mode (IWC-based versus dBZ-based) are presented. See the figure caption for details on how the data are displayed.
Figure 8a assumes F07T as a PSD and makes use of the IWC-based mode. The uncertainty in TB due to the particle type assumption is the highest for this combination. For instance, the spread of lines at the peak at 9.2∘ is almost 60 K. The uncertainty is significantly reduced in panel (c), where the dBZ-based mode is used instead. The effect is similar in panel (b), where the PSD has been switched to MH97 (but still using the IWC-based mode). In both cases the uncertainty is reduced by a factor of roughly 3. There is also a noticeable shift towards lower TB depressions when MH97 is used due to the greater emphasis on smaller particles of this PSD. The lowest spread overall is attained in panel (d), where PSD is MH97 and the dBZ-based mode is employed. The spread is reduced by roughly a factor of 6 in comparison to panel (a). The tendencies discussed here largely hold for the other frequencies as well but are not shown here.

Figure 8Simulated TBs for the same scene as in Fig. 5. The simulations in each panel assume a different PSD and model system mode. The frequency is 190.31 GHz in all panels. Employed modes are IWC-based (a, b) and dBZ-based (c, d). The PSDs are MH97 (a, c) and F07T (b, d).
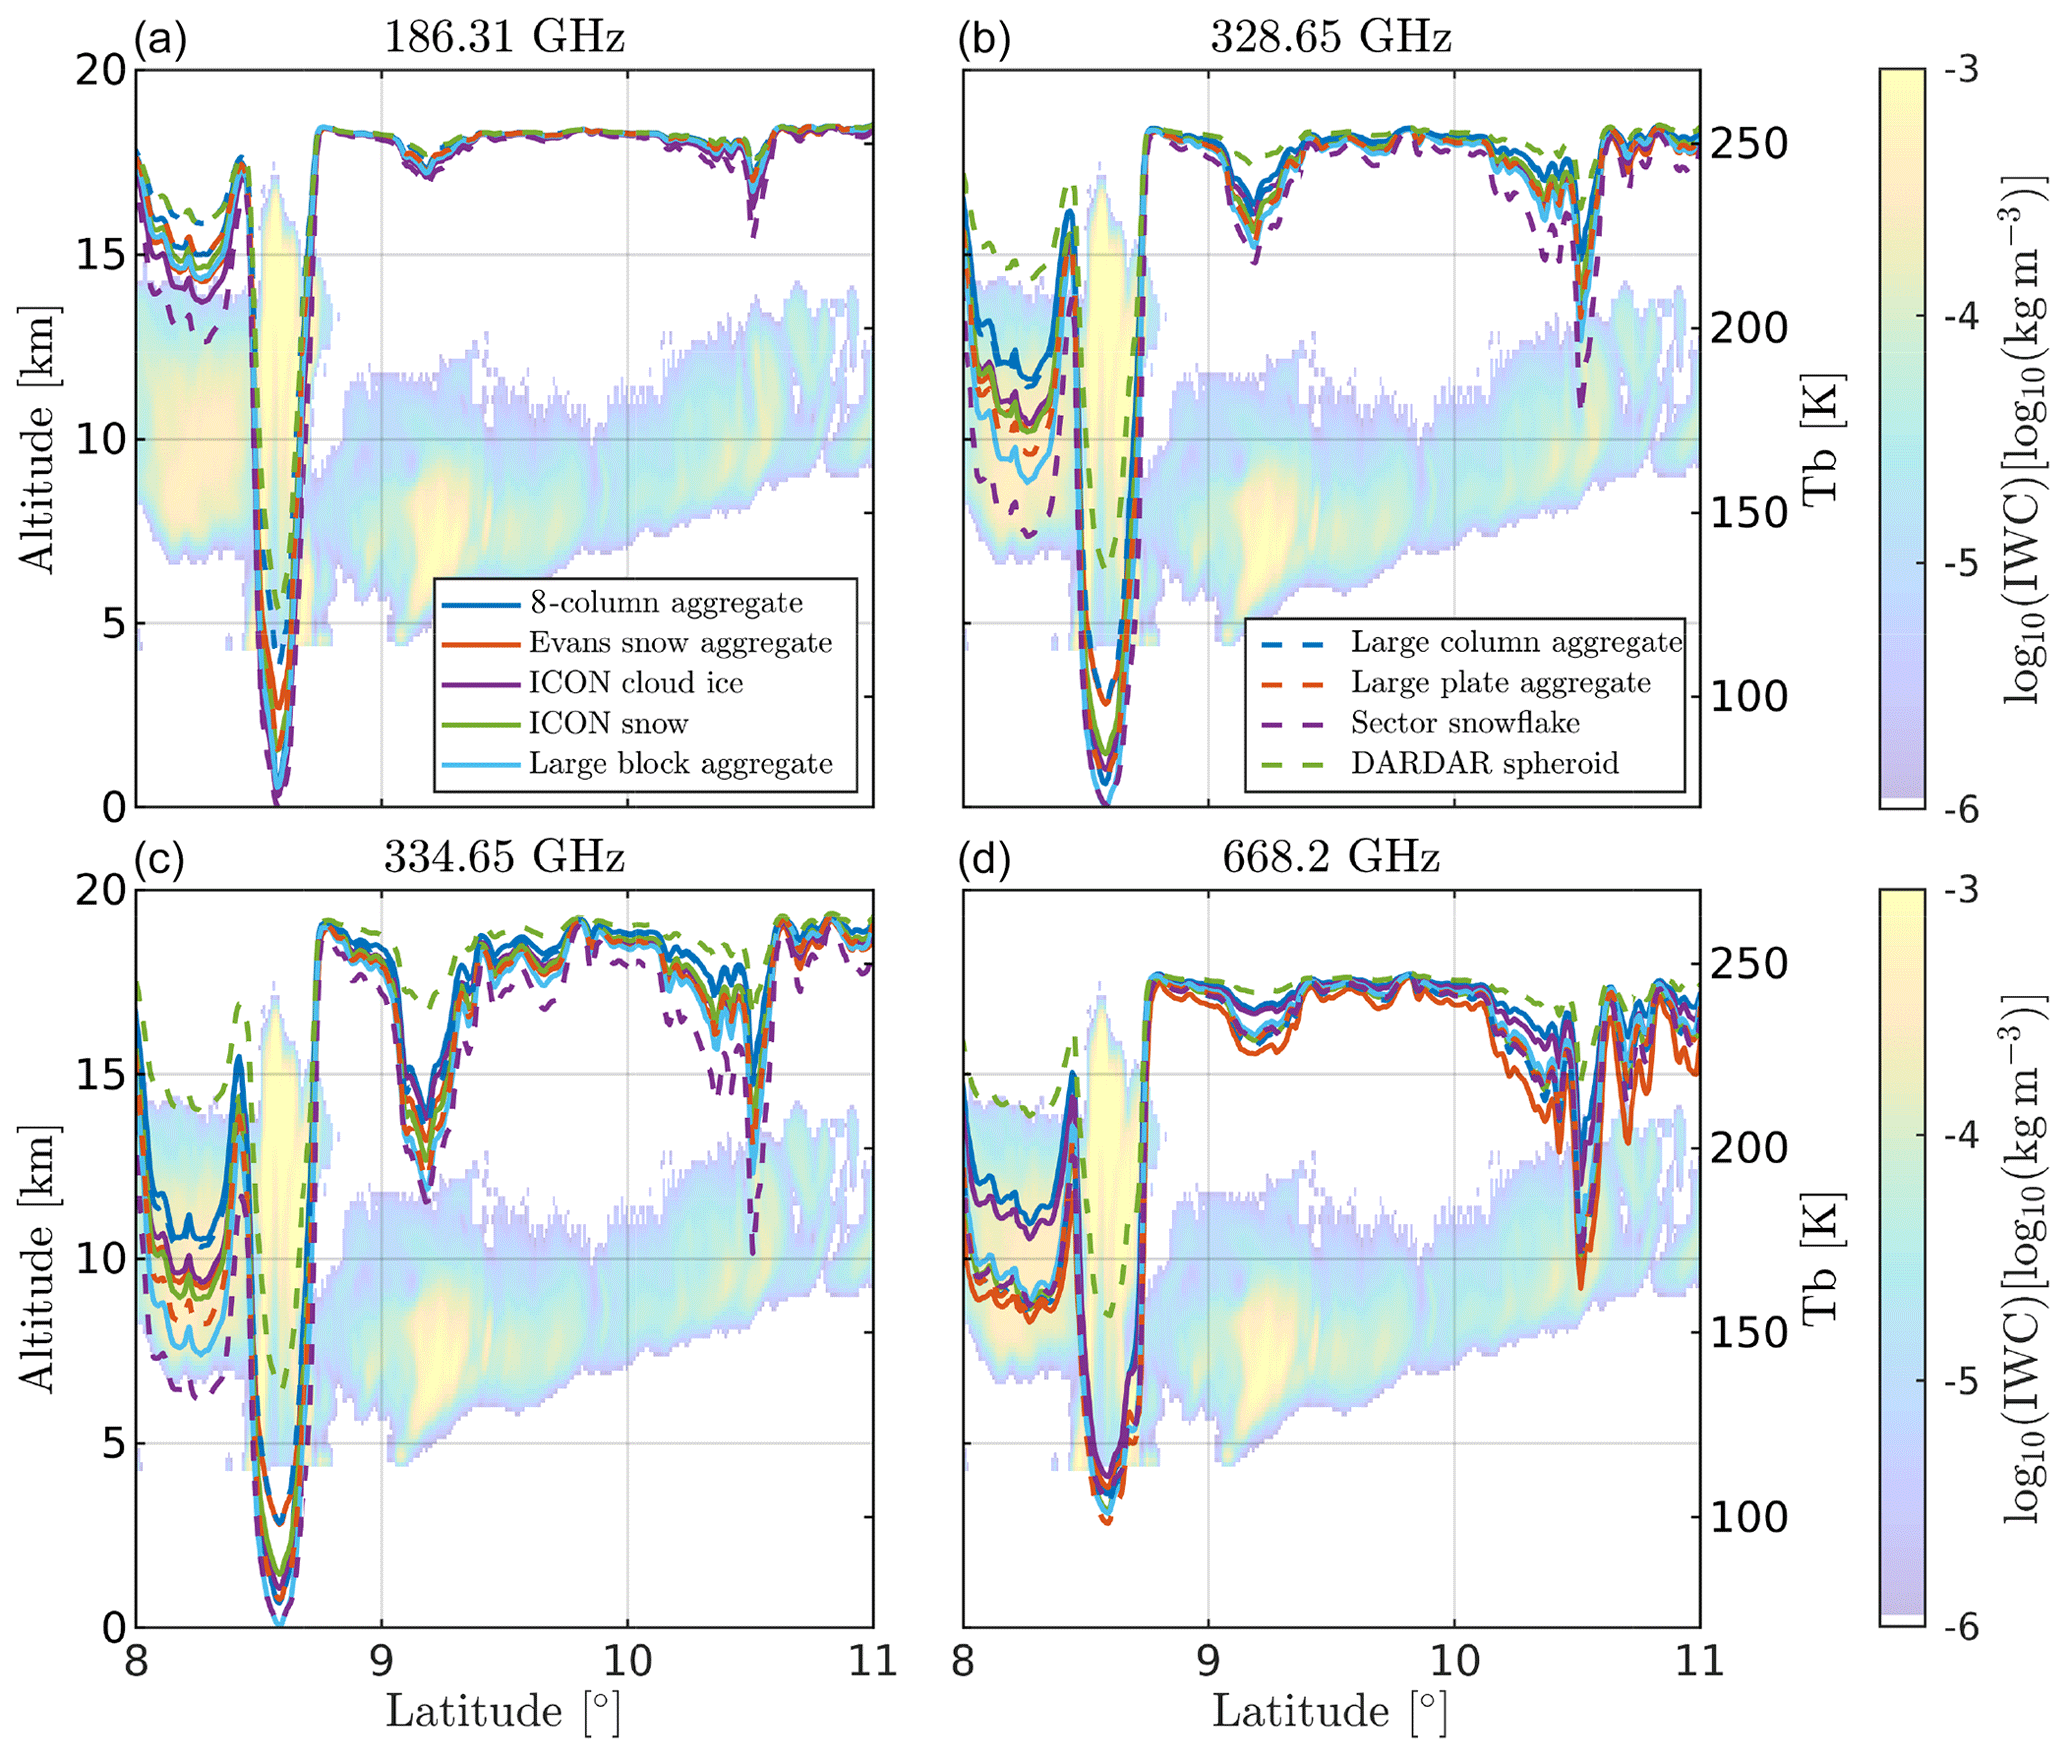
Figure 9 is similar to Fig. 8, but the model system used and PSD are kept constant for all panels. Instead, different frequencies are displayed in each panel. PSD is F07T and the dBZ-based mode is used; hence, the panels can be compared with Fig. 8c, wherein the frequency is 190.31 GHz. Panel (a) illustrates TBs at 186.31 GHz and displays similar tendencies as 190.31 GHz but with lower TB depression overall. This is a consequence of 186.31 GHz being closer to the centre of a water vapour absorption line; i.e. the TB depressions are masked by the stronger water vapour absorption at higher altitudes. The simulations at 328.65 and 334.65 GHz shown in panels (b) and (c), respectively, show similar tendencies. At 328.65 GHz, the TB depressions are lower compared to 334.65 GHz, especially at the peak at 9.2∘. As for 190.31 GHz, this is a consequence of proximity to a water vapour absorption line. Relative to the channels close to 180 GHz, the 300 GHz channels show higher TB depression for thinner clouds, as evident by the peaks at 9.2 and 10.5∘. However, the uncertainty is fairly similar in magnitude if one excludes the DARDAR-spheroid particle shown by the dashed green line. The DARDAR spheroid is a clear outlier at the higher sub-millimetre frequencies.
In Fig. 9d, simulations are shown for 668.2 GHz. This channel shows the highest TB depressions among all the channels for high-altitude thin clouds, as evident by the peaks at 10.5∘ and higher. There also seems to be a more distinct separation between different particle types. As for the 300 GHz channels, the DARDAR spheroid results in relatively low TB depressions. Furthermore, the 8-column aggregate and the ICON cloud ice are also distinguished, having clustered into a group of intermediate values of TB. The remaining particle types have clustered into a large group with high TB depressions.
4.2.3 TB distributions
This section gives a statistical overview of simulated TBs. Figure 10 displays TB occurrence frequencies for different combinations of particle types, PSDs, and model systems. Simulations using the D14 PSD are omitted here, since they produce fairly similar results compared to MH97. Black lines represent GMI data (see Sect. 2.2) at 190.31 GHz for comparison. The peak at around 270 K corresponds to simulations of clear-sky cases, which is the most frequent scenario. Lower TB values correspond to increasingly high-altitude and thick clouds. The lowest TB values are typically associated with deep convective cores, as seen in Fig. 8 for example. This was verified by partitioning the cold-simulated observations by the CloudSat classification product, revealing that around 70 % of TBs below 200 K are categorized as deep convection.
Figure 10a, which uses F07T and the IWC-based mode, shows the largest spread in lines. On the other hand, the lines cover the GMI measurements shown by the black line fairly well. In panel (b), PSD is switched to MH97, showing a clear reduction in uncertainty (as in Fig. 8). However, for MH97 there is a tendency to underestimate TB in comparison to GMI.
In Fig. 10c and d, the dBZ-based mode is used instead, showing a clear decrease in uncertainty for both PSDs. Both PSDs agree well with GMI above 170 K, showing no significant bias. It is difficult to visually distinguish which particle models agree best with GMI, the exception being the DARDAR spheroid in panel (c). However, the forward simulations tend to produce a relatively large amount of very low TBs. Only the large column aggregate agrees with GMI at these cold TBs for F07T, MH97, and D14. As already mentioned, the simulated distributions using the D14 PSD (not shown here) are similar to MH97 when the dBZ-based mode is used.
By visual inspection, agreement with GMI (channels explored) is good, indicating the robustness of the forward simulations at these frequencies. However, there is a mismatch close to the peak of the distributions, indicating that clear-sky observations do not matching perfect. The fact that for most particle and PSD combinations, distributions predict significantly colder temperatures than GMI indicates that simulated observations of deep convection do not match GMI perfectly. Simulated distributions at 166 and 186.31 GHz (not shown here) behave very similarly in comparison to the simulations at 190.31 GHz.
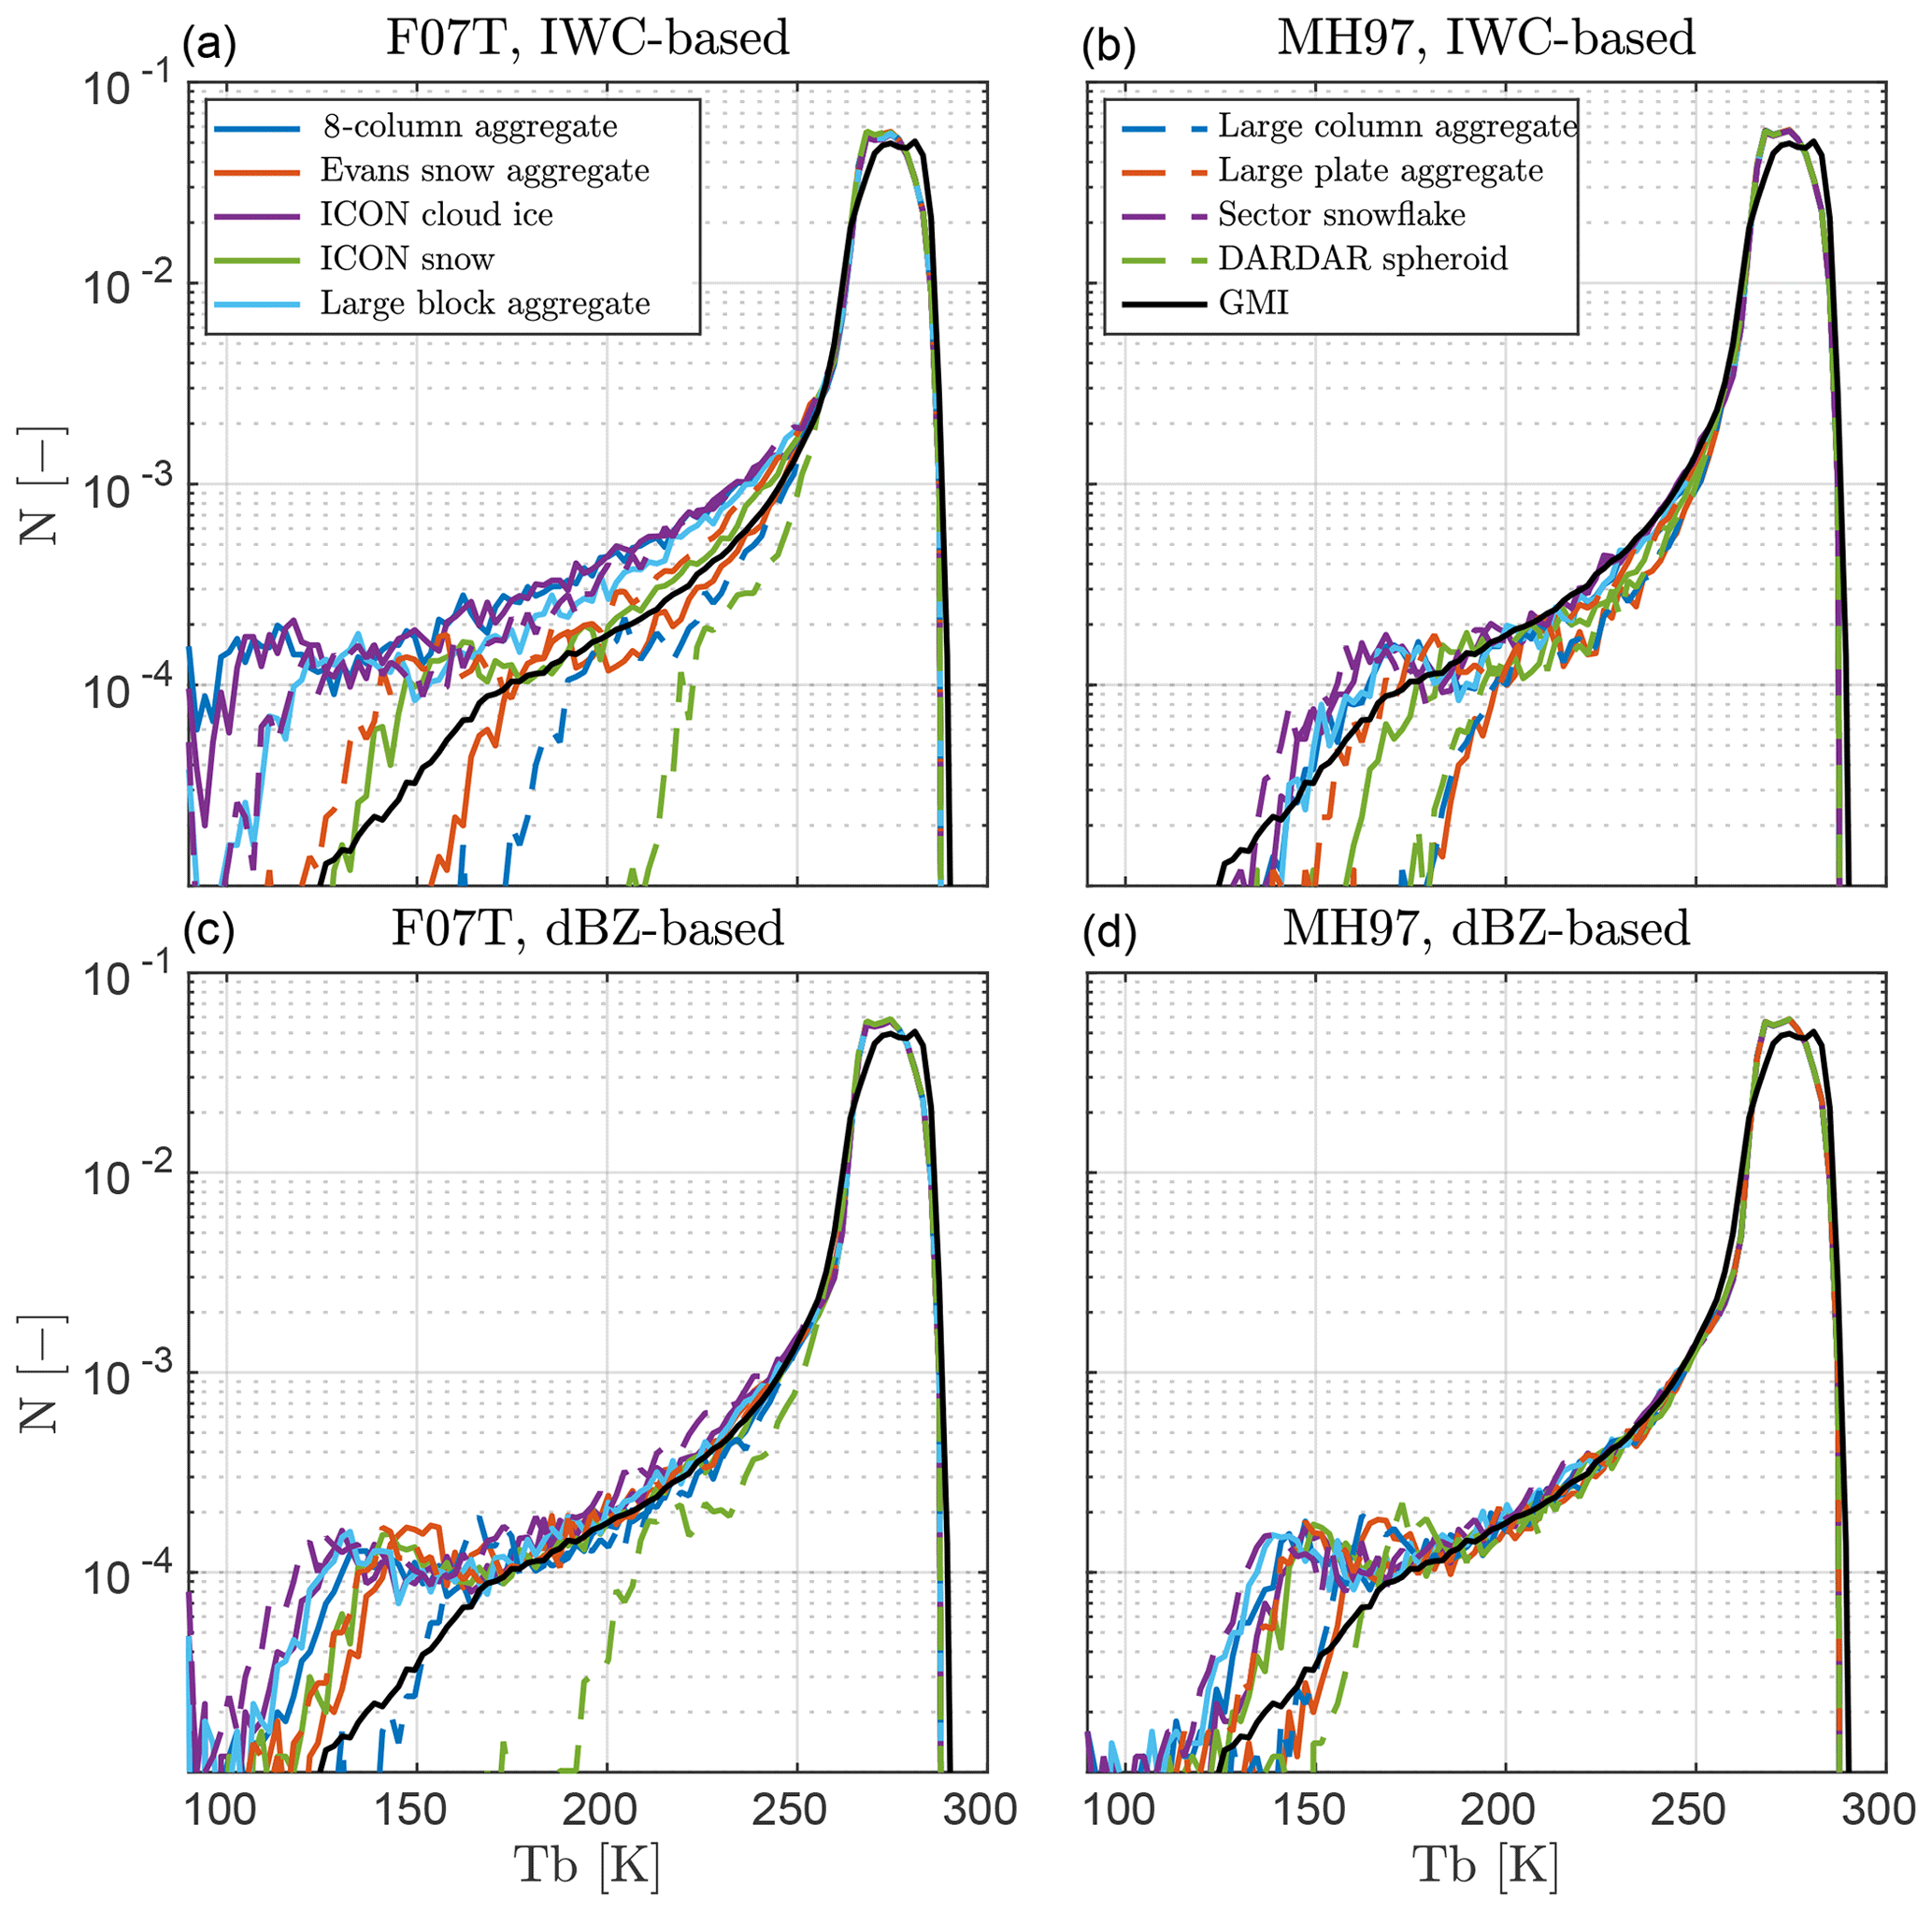
Figure 10Occurrence frequencies of TBs at 190.31 GHz assuming various particle models. Curves are normalized to have unit area. The different coloured lines represent the particle type used in the forward simulation. The black line is derived from GMI measurements. The modes used are IWC-based (a, b) and dBZ-based (c, d). The PSDs are MH97 (a, c) and F07T (b, d).
At higher simulated frequencies, there are currently no measurements available for comparison. At 328.65 and 334.65 GHz (not shown here) the spread of the lines is slightly higher in comparison to 190.31 GHz for all PSD and model mode combinations. The exception is the DARDAR spheroid, which for some combinations produces a significantly lower amount of cold TBs.
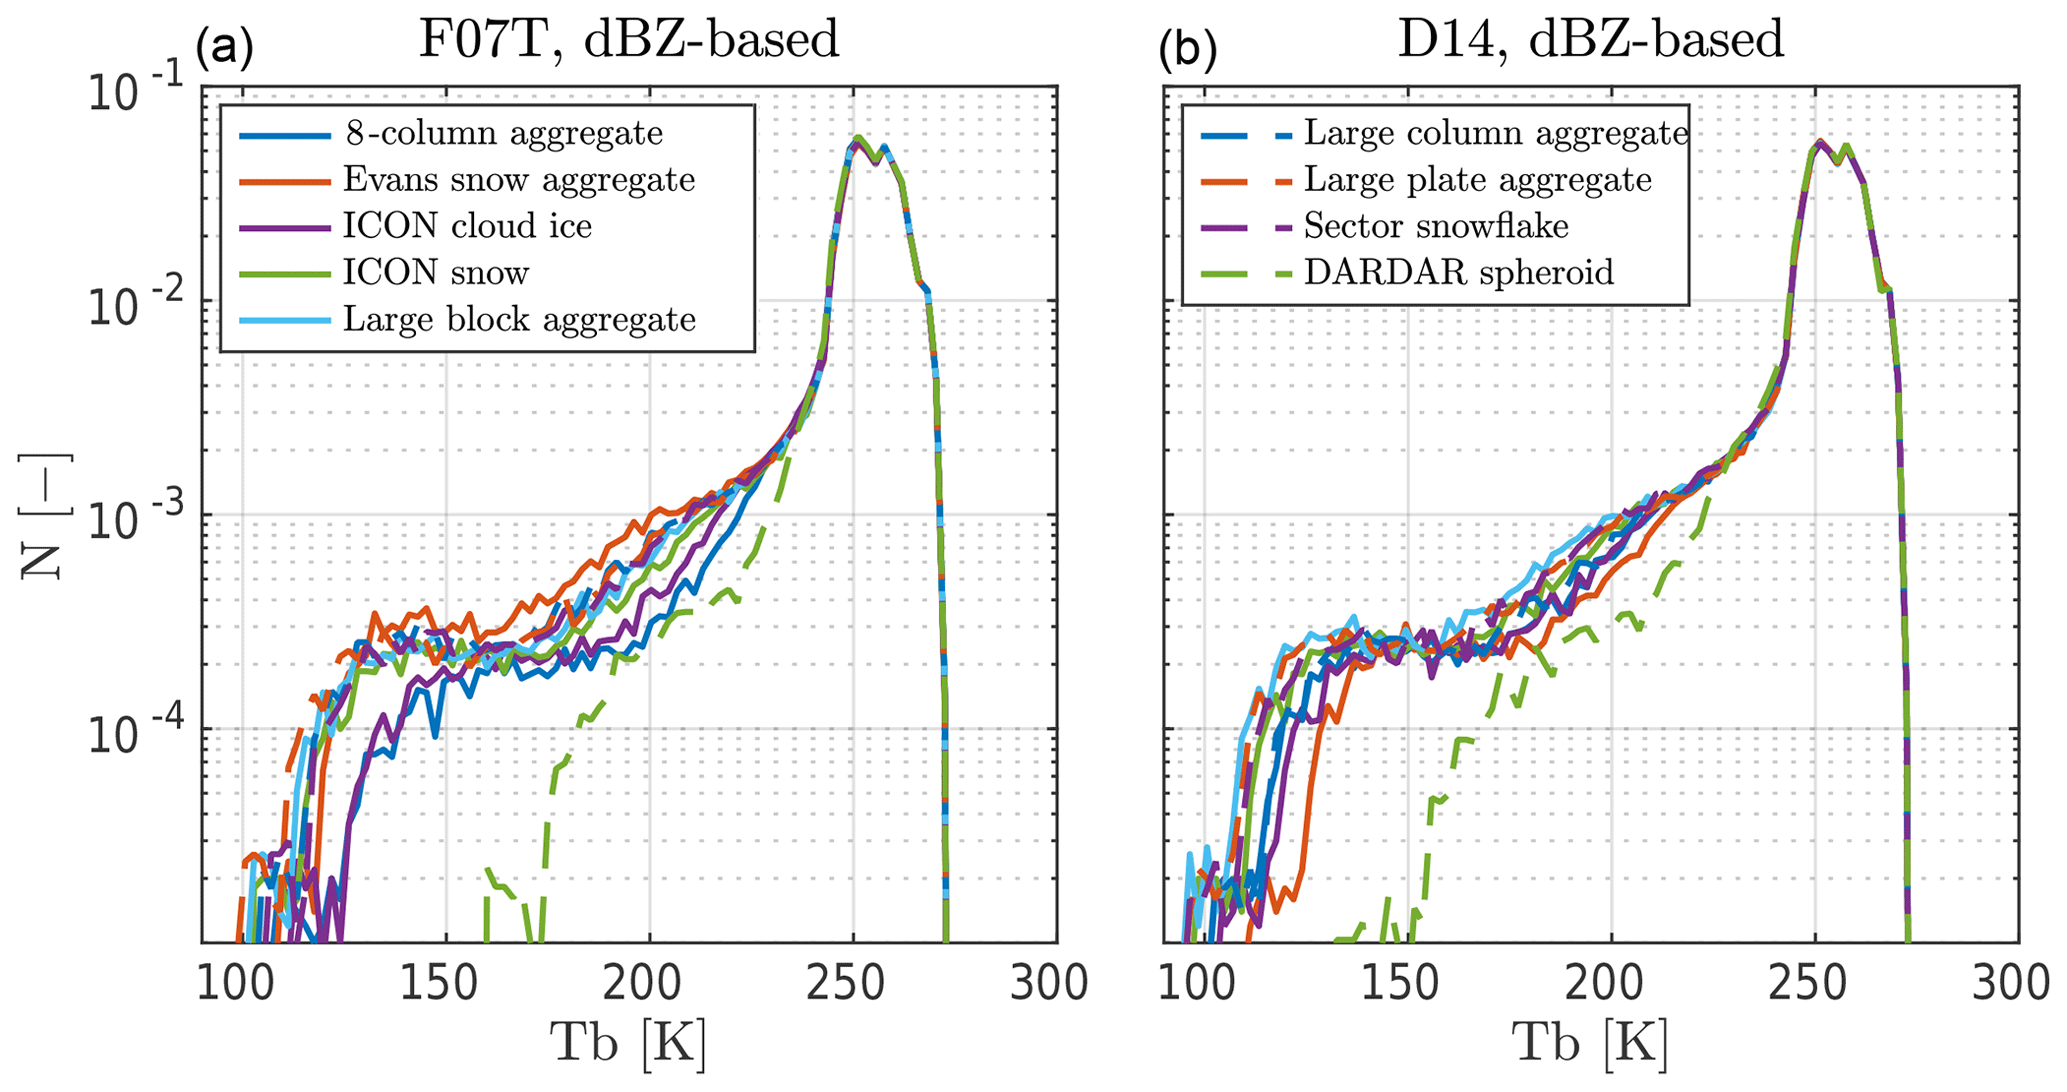
At 668.2 GHz, the picture is somewhat different. Figure 11 overviews simulated TBs at 668.2 GHz. The layout is similar to Fig. 10, but simulations using the IWC-based mode are omitted, and MH97 is switched out for D14 in panel (b). In contrast to the dBZ-based simulations at 190.31 GHz, a clear spread between particle models is observed at intermediate TB values. In essence, the simulations at 668.2 GHz demonstrate higher sensitivity to the particle type assumption than at 190.31 GHz, with some exceptions. The DARDAR spheroid is the most significant outlier, generally resulting in very warm distributions compared to the other particles.
4.2.4 Overview of performance
In order to provide an overview of the performance of the particle models and PSDs, differences between simulated and GMI-observed mean TBs are calculated. Because collocated passive and active observations were not used in this study, it is not possible to perform a quantitative error analysis. Hence, we are limited to comparing statistics for the simulations and GMI observations.
The mean TBs are derived as
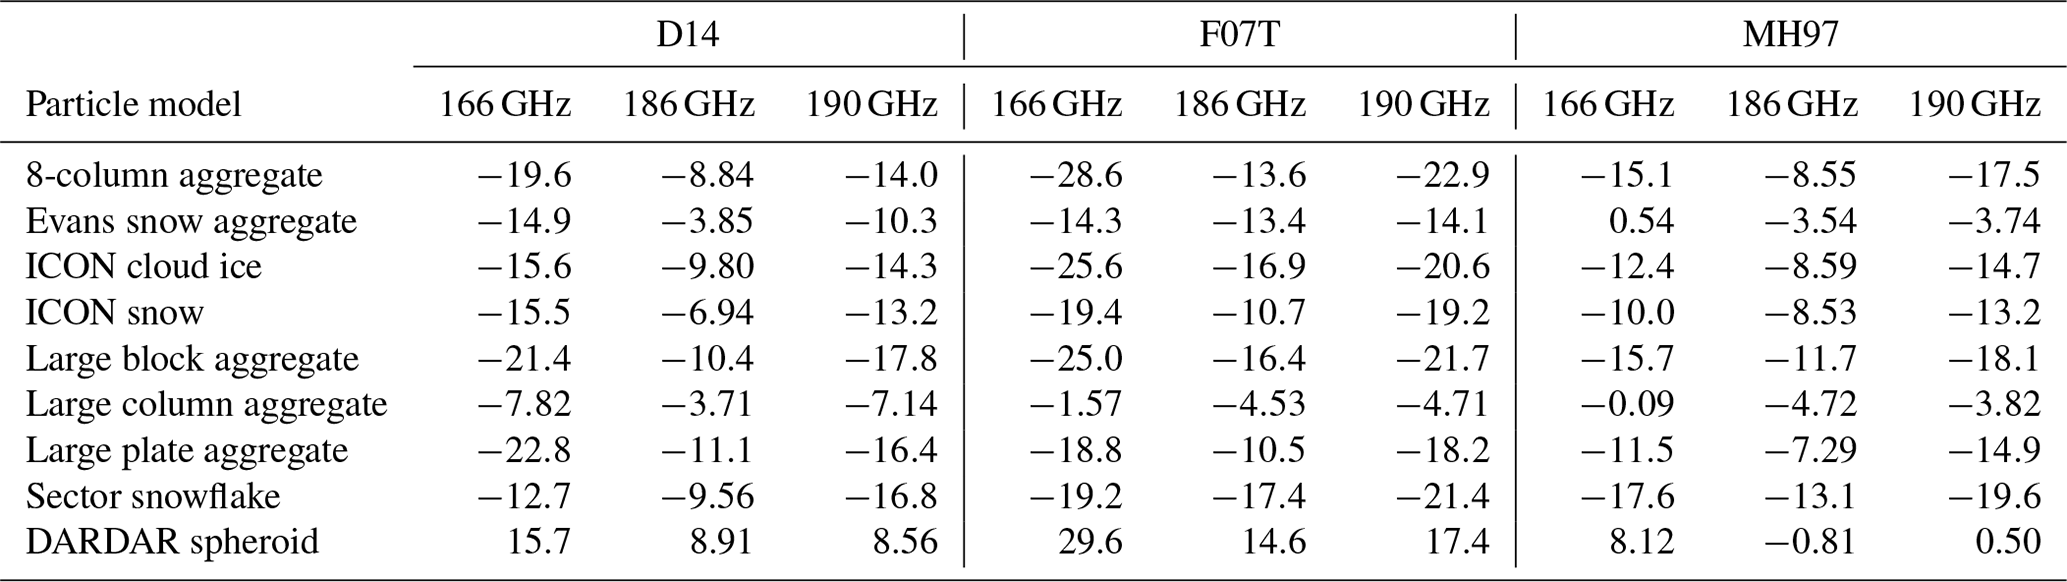
where N is the distribution of TBs. Clear-sky cases are removed by only considering TBs below a threshold of 240 K. The difference in mean TBs is then
Table 2 shows for each GMI frequency, particle model, and PSD combination. The particle and PSD combinations generally result in negative TB differences larger than 10 K for at least one channel. One exception is the DARDAR spheroid, which tends toward positive differences and surprisingly results in fairly low TB differences when combined with MH97. The large column aggregate typically results in the lowest TB differences for all PSD and frequency combinations. The Evans snow aggregate combined with MH97 yields the lowest TB differences by a small margin, but it does not perform well with the other PSDs. Focusing on the PSDs, F07T yields the largest TB differences for most frequencies and particle models, while MH97 typically yields the smallest. As previously explained, F07T puts emphasis on larger particles, explaining the stronger TB depressions compared to MH97. In summary, the large column aggregate and the Evans snow aggregate, combined with MH97, result in the lowest TB differences.
Table 2Differences between the means of simulated and GMI-observed TBs (see Eq. 7) in units of Kelvin. Only TBs below 240 K are considered, essentially filtering out clear-sky cases.
First of all, comments on the robustness of the simulations are in order. As shown in Fig. 6, the radar inversions agree fairly well with the DARDAR ice water content (IWC) product. However, it was also noted in Sect. 4.1.3 that the radar inversions put relatively low IWC at high altitudes compared to DARDAR as a consequence of the exclusion of lidar measurements in the inversions and the insensitivity of CloudSat to thin ice clouds. Calculated IWC–dBZ relationships also agree well with the relationship of Protat et al. (2016) (see Fig. 4), which is based on collocated airborne radar and in situ measurements. MH97 tends to overestimate IWC for most particle models in comparison to Protat. However, as mentioned in Sect. 4.1.1, the Protat relationship is likely influenced by azimuthally oriented particles, which enhances zenith radar backscattering (Hogan et al., 2012). Furthermore, Fig. 10 indicates that the agreement of the forward simulations with the GPM Microwave Imager (GMI) observations on a statistical level is good. The main differences appear at around 270 K, i.e. clear-sky cases. It is found that the difference in mean TB between simulated and GMI clear-sky observations is about −0.1, −4.7, and −2.6 for 166, 186.31, and 190.31 GHz, respectively. The negative biases could be an indication that ERA-Interim puts overly high relative humidity at high altitudes in the considered region, likely related to the prevalence of convection. The higher bias at 186.31 compared to 190.31 GHz further supports this claim, since water vapour absorption is stronger at 186.31 GHz.
Furthermore, no simulated distribution of simulated brightness temperature (TB) manages to fully reproduce the GMI TB distribution below 170 K. Most simulated distributions show a relatively sharp drop in frequency at relatively cold TBs in comparison to GMI. For many cases, the drop is preceded by a slight increase in occurrence frequency. The problem is most likely connected to deep convection. One possible explanation is that GMI measures warmer TBs because of azimuthally oriented particles. Since totally random particle alignment implies a decrease in zenith radar backscattering in comparison to azimuthal alignment, an increase in retrieved IWC is expected. The increase in IWC should then lead to an enhancement in the simulated TB depressions, given that forward simulations (of intensity) are not strongly affected by particle orientation at an incidence of 53∘, as indicated by the results of Brath et al. (2019). Testing this hypothesis requires azimuthally oriented data, which at the time of this study were not publicly available. On the other hand, previous studies also indicate that ice particles in deep convection are likely totally randomly oriented dense particles such as hail and graupel, as inferred from the low observed polarization signals (Gong and Wu, 2017; Brath et al., 2019). Further investigation is needed in order to explain these discrepancies.
Regarding sensitivity to assumed microphysics of the forward simulations, simulated TB distributions are indeed sensitive to the assumed particle model at all frequencies, as evident in Fig. 10a and b, wherein the IWC-based approach was employed. In short, in the IWC-based approach, fixed IWC fields (i.e. from the DARDAR product) are used as input to the forward simulations. Similarly, the radar-retrieved IWC fields (see Fig. 6) show significant sensitivity to the particle model as well, resulting in a spread of over 1 order of magnitude depending on the assumed PSD. Whether the application is assimilation or retrievals, the results show the importance of the correct representation of the ice microphysics in radiative transfer (RT) modelling for both passive measurements at frequencies above 180 GHz and radar measurements at 94.1 GHz. As indicated by Fig. 1, it is predominantly larger particles (roughly 1 mm and larger) that contribute to the observed discrepancies for both active and passive measurements.
However, an analysis of simulated TB distributions reveals little about the performance of the tested particle models. The other model mode, the dBZ-based approach, uses CloudSat dBZ fields as direct input (see Fig. 3 for a schematic overview), ensuring that microphysical assumptions are consistent for both the active and passive sensor. When using the dBZ-based mode, simulated TB distributions reveal little sensitivity to the assumed particle model, as seen in Fig.10c and d. This is mainly explained by a compensation effect, as illustrated in Fig. 7. The extinction coefficient γext, arguably the most important parameter in microwave radiometry, is indeed sensitive to the hydrometeor particle type, as shown in panel (c). When γext is expressed as a function of radar reflectivity (see panel b), a more compact collection of lines is attained. The extinction coefficient at 190.31 GHz is to some extent less dependent upon particle type when expressed in radar reflectivity in comparison to IWC. For instance, the 8-column aggregate tends to result in very low IWC (Fig. 4), since it is a very efficient backscatterer. However, since it is an equally efficient attenuator (Fig. 7c), the resulting TBs end up at similar values compared to the other particles.
At intermediate TBs (between 170 and 250 K), most particles produce TB distributions at 166, 186.31, and 190.31 GHz that lie close to GMI. The only consistent noticeable outlier is the DARDAR spheroid, which tends toward very warm TB distributions when combined with F07T and D14 (not shown). As discussed above, disagreement with GMI is mainly visible below 170 K, with most particles resulting in very cold TB distributions. No PSD and particle combination is able to fully mimic the GMI curve. Nonetheless, for some cases the distributions end up fairly close. For instance, in the case of MH97, which results in a relatively low spread between distributions, the large column aggregate, Evans snow aggregate, and the DARDAR spheroid lie fairly close to GMI. This is also reflected in Table 2, showing relatively low differences in mean TBs compared to GMI for these combinations. But only the large column aggregate is found to lie close to GMI for all PSD and frequencies (Fig. 10c, d and Table 2). Interestingly, the large column aggregate is among the weakest scatterers (see Fig. 1), which is also the case for the DARDAR spheroid. The difference is that the DARDAR spheroid is also an excessively weak backscatterer at large particle sizes. At high IWC, the large column aggregate tends toward lower reflectivity values in comparison to Protat et al. (2016), while at intermediate IWC (≈102 mg m−3) a good agreement is found when employing F07T and D14 (see Fig. 4). As mentioned previously, assuming a totally random orientation should yield lower reflectivity values in comparison to Protat; i.e. the disagreement is to some extent expected. Regarding the radar inversions, in comparison to the DARDAR IWC product, they put fairly high IWC at mid-altitudes (see Figs. 5 and 6). However, since the DARDAR product does not account for cloud attenuation of the radar signal, DARDAR IWC is expected to be underestimated to some degree.
All PSDs managed to largely reproduce the GMI distribution, except for the discrepancies already discussed. D14 tends to produce marginally warmer distributions compared to GMI at 166, 186.31, and 190.31 GHz (not shown). The same can be said for MH97, mostly for 186.31 GHz (not shown), and also slightly for 190.31 GHz (compare to F07T at 260 K in Fig. 10c and d). F07T shows no obvious bias compared to GMI but is instead the PSD for which the spread between particle models is the highest. Overall, MH97 could be argued to perform the best in terms of agreement with GMI, typically resulting in the smallest differences in mean TB in Table 2. It also agrees fairly well with the dBZ–IWC relationship of Protat et al. (2016) (see Fig. 4), especially if particle orientation is taken into consideration.
Overall, the attempt to constrain assumed microphysics using CloudSat and GMI measurements produced fairly inconclusive results. The best agreement with GMI was found for the large column aggregate and Evans snow aggregate when combined with the MH97 PSD (see Table 2). However, the failure of the forward model to mimic the GMI distribution at cold TBs suggests this conclusion should be taken with a grain of salt. On the other hand, the DARDAR spheroid is revealed as a fairly poor representation of ice considering its tendency towards very warm TB distributions, especially at the higher sub-millimetre frequencies. No judgement with respect to its performance in radar and lidar retrievals is made here; however, for passive radiometry at frequencies above 180 GHz, it deviates significantly from the more realistic models. Also, compared to the other particles and the DARDAR IWC product, it produces significantly higher IWC in the radar inversions, especially using the D14 PSD (see Fig. 6). As a test, forward simulations assuming the DARDAR spheroid, D14, and DARDAR-retrieved IWC and fields were performed, essentially to check whether the DARDAR product and its assumptions could reproduce GMI measurements. A small improvement is gained compared to using the a priori determined fields (i.e. using Eq. 3). However, the resulting TB distribution was still found to be significantly warmer compared to GMI. Whether this disagreement is due to the particle model or the DARDAR retrievals themselves is difficult to conclude based on this paper alone. However, it does highlight the DARDAR spheroid's inability to yield consistent results in a combined active and passive microwave setting. A similar conclusion was reached by Kulie et al. (2010) for soft spheres. As a final disclaimer, the scattering data for the DARDAR spheroid were (as stated in Sect. 2.6) reproduced according to information given in Delanoë et al. (2014) and using the T-matrix method to the best of our abilities. In order to test our implementation of the DARDAR spheroid, radar reflectivity fields were calculated for the scene in Fig. 5 assuming the DARDAR spheroid, D14, and DARDAR-retrieved IWC and fields, (without accounting for radar attenuation, as is the case for the DARDAR retrievals). The reflectivity fields were then compared to the corresponding CloudSat measurements. Agreement is generally acceptable; the difference is generally less than 2 dBZ. However, errors over 5 dBZ were found in the convective core. Hence, we acknowledge that some inconsistencies in our implementation of the DARDAR spheroid model are possible.
Better agreement with observations could of course also be achieved with a more advanced microphysical scheme. For instance, the CloudSat cloud classification product (2B-CLDCLASS) can be used to guide microphysical assumptions in specific cloud scenarios. This was omitted in this study due to the difficulty in performing a quantitative error analysis of the simulations. Instead, this study evaluates the ability of each particle model and PSD combination to work as a “one-size-fit-all” microphysical parameterization.
Finally, as a comment on the significance of this study for the upcoming Ice Cloud Imager (ICI) mission: simulated distributions at frequencies above 300 GHz revealed a significantly higher degree of sensitivity to the particle model for the dBZ-based simulations than what was found at the lower frequencies. As seen in Fig. 7c, the relationship between γext and radar reflectivity at 664 GHz is indeed more sensitive to the particle model than for 190.31 GHz. Hence, there is an indication that the methodology presented in this paper, with input from ICI and a high-frequency radar (e.g. CloudSat CPR or the upcoming EarthCARE CPR), could a be useful tool for refining particle models. To some extent, this study also supports the notion of combined sub-millimetre radiometer and high-frequency radar measurements from a retrieval point of view, which, for example, could potentially be used to retrieve PSD moments (Pfreundschuh et al., 2019).
This paper has presented simulated brightness temperature (TB) measurements in the tropical Pacific Ocean taken by the GPM Microwave Imager (GMI) and the upcoming Ice Cloud Imager (ICI) based on synthetic scenes using CloudSat measurements as a basis. Forward passive simulations use either ice water content (IWC) fields from the DARDAR product (the IWC-based approach) or first convert CloudSat reflectivity values to IWC fields assuming microphysics (i.e. particle model and size distribution) that are fully consistent with the forward simulations (the dBZ-based approach). The main goal was to evaluate and constrain a selection of particle models from the ARTS (Atmospheric Radiative Transfer Simulator) single scattering database (Eriksson et al., 2018) by analysing their ability to model observations by both CloudSat and GMI. The advantage of the method is that it does not require collocated passive and active measurements, which are scarce around the Equator. The limitation is that it does not allow for a quantitative error analysis. Instead, one is limited to approximate comparisons of statistics and visual interpretation. The main conclusions are as follows.
-
Simulated TB distributions at 166, 186.31, and 190.31 GHz overall agree well with GMI. The biggest issues occur under clear-sky conditions, likely due to biases in ERA-Interim reported humidity fields and, for the most severe cases of deep convection, possibly due to the fact that azimuthal particle orientation is not considered in the radiative transfer model employed here.
-
The simulated distributions at GMI frequencies proved to be fairly insensitive to the assumed particle model and particle size distribution (PSD), at least at intermediate TBs. Most particle models seem to yield scattering consistent with both CloudSat and GMI observations. Hence, it was not possible to find a particle model that clearly performs better than the others. The large column aggregate and Evans snow aggregate combined with the MH97 PSD seem to be best overall, since they reproduce the very cold TBs of GMI fairly well. The other particles and PSD combinations typically result in distributions that are too cold, as mentioned previously. The exception is the soft-spheroid particle model (used in the DARDAR product), generally producing TBs that are too warm. Interestingly, it agrees well with GMI when combined with the MH97 PSD.
-
In comparison to the dBZ-based approach, the IWC-based simulations were found to be highly sensitive to the assumed particle model and PSD, including at the higher sub-millimetre frequencies (328.65, 334.65, and 668.2 GHz). It is mainly the larger particles that contribute to the discrepancies in simulated TBs. This highlights the importance of the correct microphysical representation in radiate transfer modelling of high microwave and sub-millimetre passive measurements.
-
The assumed particle model also has a significant impact upon IWC fields retrieved by radar. Differences of over 1 order of magnitude are found in retrieved IWC fields between employed particle models. The soft-spheroid model also stands out here, resulting in significantly higher IWC compared to the other particles, as a relatively weak scatterer.
-
Of the tested PSDs, the one by McFarquhar and Heymsfield (1997) results in TB distributions that for most particle models closely resemble the distribution of GMI measurements. It also produces IWC–radar reflectivity relationships that agree fairly well with the empirical relationship by Protat et al. (2016).
While this study proved inconclusive with respect to its main goal, it still serves as a demonstration of the methodology used for evaluating microphysics and highlights the importance of continued work. The simulations at sub-millimetre frequencies are promising for the sake of the upcoming ICI mission, the first planned operational satellite aimed towards measuring atmospheric ice at such frequencies. It will offer additional sensitivity to smaller ice particles, as indicated by the simulations performed in this study. This study shows that, using the presented methodology, combined measurements by ICI and a 94 GHz cloud-profiling radar could potentially be used to constrain microphysical parameterizations, i.e. particle shape, PSD, and possibly orientation.
The methodology should also be extended to consider passive infrared (IR) measurements (e.g. IIR aboard CALIPSO or MODIS on Aqua), providing additional microphysical constraints (to the PSD in particular) and sensitivity to smaller ice crystals that radar is lacking. Information is typically only gained in the cloud-top environment at IR frequencies; however, improved constraining of microphysics at these levels would benefit the analysis of concurrent levels as well. This was omitted in this study, since the infrared spectrum is not covered by the ARTS scattering database. At these high frequencies, the discrete dipole approximation (DDA), traditionally used at microwave wavelengths, is not applicable for calculating the scattering properties, and surface roughness and inhomogeneities such as air bubbles play an important role (Tang et al., 2017). So far, only the database by Yang et al. (2005) covers such frequencies (extended by Ding et al., 2017, to also include microwaves). Future studies should also consider scattering data describing melting hydrometeors (Johnson et al., 2016; Ori et al., 2014) and oriented ice particles (Brath et al., 2018).
Available upon request.
RE implemented the simulations and performed the data analysis, with advice and assistance from PE. RE also wrote the paper, with feedback from PE and SP. Finally, PE and SP contributed with the code needed to implement the simulations.
The authors declare that they have no conflict of interest.
First of all, thanks to the reviewers for their fair and insightful feedback. The authors would also like to thank their colleagues at the Department of Space, Earth and Environment, Chalmers University of Technology, who provided suggestions and support for the data analysis. Finally, special thanks go to Vasileios Barlakas, who also provided detailed feedback on the paper.
This research has been supported by the Swedish National Space Agency (grant no. 150/44).
This paper was edited by Mark Kulie and reviewed by two anonymous referees.
Battaglia, A. and Simmer, C.: How does multiple scattering affect the spaceborne W-band radar measurements at ranges close to and crossing the sea-surface range?, IEEE T. Geosci. Remote, 46, 1644–1651, https://doi.org/10.1109/TGRS.2008.916085, 2008. a
Bennartz, R. and Bauer, P.: Sensitivity of microwave radiances at 85–183 GHz to precipitating ice particles, Radio Sci., 38, https://doi.org/10.1029/2002RS002626, 2003. a
Brath, M., Fox, S., Eriksson, P., Harlow, R. C., Burgdorf, M., and Buehler, S. A.: Retrieval of an ice water path over the ocean from ISMAR and MARSS millimeter and submillimeter brightness temperatures, Atmos. Meas. Tech., 11, 611–632, https://doi.org/10.5194/amt-11-611-2018, 2018. a, b, c
Brath, M., Ekelund, R., Eriksson, P., Lemke, O., and Buehler, S. A.: Microwave and submillimeter wave scattering of oriented ice particles, Atmos. Meas. Tech. Discuss., https://doi.org/10.5194/amt-2019-382, in review, 2019. a, b
Buehler, S. A., Jiménez, C., Evans, K. F., Eriksson, P., Rydberg, B., Heymsfield, A. J., Stubenrauch, C. J., Lohmann, U., Emde, C., John, V. O., Sreerekha, T. R., and Davis, C. P.: A concept for a satellite mission to measure cloud ice water path, ice particle size, and cloud altitude, Q. J. Roy. Meteorol. Soc., 133, 109–128, https://doi.org/10.1002/qj.143, 2007. a
Buehler, S. A., Mendrok, J., Eriksson, P., Perrin, A., Larsson, R., and Lemke, O.: ARTS, the Atmospheric Radiative Transfer Simulator – version 2.2, the planetary toolbox edition, Geosci. Model Dev., 11, 1537–1556, https://doi.org/10.5194/gmd-11-1537-2018, 2018. a
Bühl, J., Alexander, S., Crewell, S., Heymsfield, A., Kalesse, H., Khain, A., Maahn, M., Tricht, K. V., and Wendisch, M.: Remote sensing, Meteorol. Monogr., 58, 10.1–10.21, https://doi.org/10.1175/AMSMONOGRAPHS-D-16-0015.1, 2017. a, b
Burns, B., Wu, X., and Diak, G.: Effects of precipitation and cloud ice on brightness temperatures in AMSU moisture channels, IEEE T. Geosci. Remote, 35, 1429–1437, https://doi.org/10.1109/36.649797, 1997. a
Cazenave, Q., Ceccaldi, M., Delanoë, J., Pelon, J., Groß, S., and Heymsfield, A.: Evolution of DARDAR-CLOUD ice cloud retrievals: new parameters and impacts on the retrieved microphysical properties, Atmos. Meas. Tech., 12, 2819–2835, https://doi.org/10.5194/amt-12-2819-2019, 2019. a
Davis, C. P., Wu, D. L., Emde, C., Jiang, J. H., Cofield, R. E., and Harwood, R. S.: Cirrus induced polarization in 122 GHz aura Microwave Limb Sounder radiances, Geophys. Res. Lett., 32, L14806, https://doi.org/10.1029/2005GL022681, 2005. a
Delanoë, J. and Hogan, R. J.: Combined CloudSat-CALIPSO-MODIS retrievals of the properties of ice clouds, J. Geophys. Res., 115, D00H29, https://doi.org/10.1029/2009JD012346, 2010. a
Delanoë, J. M. E., Heymsfield, A. J., Protat, A., Bansemer, A., and Hogan, R. J.: Normalized particle size distribution for remote sensing application, J. Geophys. Res.-Atmos., 119, 4204–4227, https://doi.org/10.1002/2013JD020700, 2014. a, b, c, d
Ding, J., Bi, L., Yang, P., Kattawar, G. W., Weng, F., Liu, Q., and Greenwald, T.: Single-scattering properties of ice particles in the microwave regime: Temperature effect on the ice refractive index with implications in remote sensing, J. Quant. Spectrosc. Ra., 190, 26–37, https://doi.org/10.1016/j.jqsrt.2016.11.026, 2017. a, b
Ekelund, R. and Eriksson, P.: Impact of ice aggregate parameters on microwave and sub-millimetre scattering properties, J. Quant. Spectrosc. Ra., 224, 233–246, https://doi.org/10.1016/j.jqsrt.2018.11.013, 2019. a
Ellison, W. J.: Permittivity of pure water, at standard atmospheric pressure, over the frequency range 0–25 THz and the temperature range 0–100 ∘C, J. Phys. Chem. Ref. Data., 36, 1–18, https://doi.org/10.1063/1.2360986, 2007. a
Eriksson, P., Ekström, M., Rydberg, B., and Murtagh, D. P.: First Odin sub-mm retrievals in the tropical upper troposphere: ice cloud properties, Atmos. Chem. Phys., 7, 471–483, https://doi.org/10.5194/acp-7-471-2007, 2007. a
Eriksson, P., Rydberg, B., Sagawa, H., Johnston, M. S., and Kasai, Y.: Overview and sample applications of SMILES and Odin-SMR retrievals of upper tropospheric humidity and cloud ice mass, Atmos. Chem. Phys., 14, 12613–12629, https://doi.org/10.5194/acp-14-12613-2014, 2014. a
Eriksson, P., Jamali, M., Mendrok, J., and Buehler, S. A.: On the microwave optical properties of randomly oriented ice hydrometeors, Atmos. Meas. Tech., 8, 1913–1933, https://doi.org/10.5194/amt-8-1913-2015, 2015. a
Eriksson, P., Ekelund, R., Mendrok, J., Brath, M., Lemke, O., and Buehler, S. A.: A general database of hydrometeor single scattering properties at microwave and sub-millimetre wavelengths, Earth Syst. Sci. Data, 10, 1301–1326, https://doi.org/10.5194/essd-10-1301-2018, 2018. a, b, c, d, e, f
Evans, K. F., Wang, J. R., O'C Starr, D., Heymsfield, G., Li, L., Tian, L., Lawson, R. P., Heymsfield, A. J., and Bansemer, A.: Ice hydrometeor profile retrieval algorithm for high-frequency microwave radiometers: application to the CoSSIR instrument during TC4, Atmos. Meas. Tech., 5, 2277–2306, https://doi.org/10.5194/amt-5-2277-2012, 2012. a
Field, P. R., Heymsfield, A. J., and Bansemer, A.: Snow size distribution parameterization for midlatitude and tropical ice clouds, J. Atmos. Sci., 64, 4346–4365, https://doi.org/10.1175/2007JAS2344.1, 2007. a
Fox, S., Mendrok, J., Eriksson, P., Ekelund, R., O'Shea, S. J., Bower, K. N., Baran, A. J., Harlow, R. C., and Pickering, J. C.: Airborne validation of radiative transfer modelling of ice clouds at millimetre and sub-millimetre wavelengths, Atmos. Meas. Tech., 12, 1599–1617, https://doi.org/10.5194/amt-12-1599-2019, 2019. a, b, c, d, e
Galligani, V. S., Prigent, C., Defer, E., Jimenez, C., Eriksson, P., Pinty, J.-P., and Chaboureau, J.-P.: Meso-scale modelling and radiative transfer simulations of a snowfall event over France at microwaves for passive and active modes and evaluation with satellite observations, Atmos. Meas. Tech., 8, 1605–1616, https://doi.org/10.5194/amt-8-1605-2015, 2015. a, b
Galligani, V. S., Wang, D., Alvarez Imaz, M., Salio, P., and Prigent, C.: Analysis and evaluation of WRF microphysical schemes for deep moist convection over south-eastern South America (SESA) using microwave satellite observations and radiative transfer simulations, Atmos. Meas. Tech., 10, 3627–3649, https://doi.org/10.5194/amt-10-3627-2017, 2017. a
Garnett, J. C. M.: Colours in metal glasses and in metallic films, Phil. Trans. R. Soc. Lond. A, 203, 385–420, https://doi.org/10.1098/rsta.1904.0024, 1904. a
Geer, A. J. and Baordo, F.: Improved scattering radiative transfer for frozen hydrometeors at microwave frequencies, Atmos. Meas. Tech., 7, 1839–1860, https://doi.org/10.5194/amt-7-1839-2014, 2014. a, b, c, d
Gong, J. and Wu, D. L.: Microphysical properties of frozen particles inferred from Global Precipitation Measurement (GPM) Microwave Imager (GMI) polarimetric measurements, Atmos. Chem. Phys., 17, 2741–2757, https://doi.org/10.5194/acp-17-2741-2017, 2017. a
Hogan, R. J., Tian, L., Brown, P. R., Westbrook, C. D., Heymsfield, A. J., and Eastment, J. D.: Radar scattering from ice aggregates using the horizontally aligned oblate spheroid approximation, J. Appl. Meteorol. Clim., 51, 655–671, https://doi.org/10.1175/JAMC-D-11-074.1, 2012. a, b
Hong, G., Yang, P., Baum, B. A., Heymsfield, A. J., Weng, F., Liu, Q., Heygster, G., and Buehler, S. A.: Scattering database in the millimeter and submillimeter wave range of 100–1000 GHz for nonspherical ice particles, J. Geophys. Res., 114, D06201, https://doi.org/10.1029/2008JD010451, 2009. a, b
Hong, G., Heygster, G., Notholt, J., Weng, F., and Liu, Q.: Simulations of microwave brightness temperatures at AMSU-B frequencies over a 3D convective cloud system, Int. J. Remote Sensing, 31, 1781–1800, https://doi.org/10.1080/01431160902926640, 2010. a
Hou, A. Y., Kakar, R. K., Neeck, S., Azarbarzin, A. A., Kummerow, C. D., Kojima, M., Oki, R., Nakamura, K., and Iguchi, T.: The global precipitation measurement mission, B. Am. Meteorol. Soc., 95, https://doi.org/10.1175/BAMS-D-13-00164.1, 2014. a, b, c
Johnson, B. T., Olson, W. S., and Skofronick-Jackson, G.: The microwave properties of simulated melting precipitation particles: sensitivity to initial melting, Atmos. Meas. Tech., 9, 9–21, https://doi.org/10.5194/amt-9-9-2016, 2016. a
Kneifel, S., Lerber, A., Tiira, J., Moisseev, D., Kollias, P., and Leinonen, J.: Observed relations between snowfall microphysics and triple-frequency radar measurements, J. Geophys. Res.-Atmos., 120, 6034–6055, https://doi.org/10.1002/2015JD023156, 2015. a
Kulie, M. S., Bennartz, R., Greenwald, T. J., Chen, Y., and Weng, F.: Uncertainties in microwave properties of frozen precipitation: Implications for remote sensing and data assimilation, J. Atmos. Sci., 67, 3471–3487, https://doi.org/10.1175/2010JAS3520.1, 2010. a, b, c, d, e
Kulie, M. S., Hiley, M. J., Bennartz, R., Kneifel, S., and Tanelli, S.: Triple-frequency radar reflectivity signatures of snow: Observations and comparisons with theoretical ice particle scattering models, J. Appl. Meteorol. Clim., 53, 1080–1098, https://doi.org/10.1175/JAMC-D-13-066.1, 2014. a
Kuo, K.-S., Olson, W. S., Johnson, B. T., Grecu, M., Tian, L., Clune, T. L., van Aartsen, B. H., Heymsfield, A. J., Liao, L., and Meneghini, R.: The microwave radiative properties of falling snow derived from nonspherical ice particle models. Part I: An extensive database of simulated pristine crystals and aggregate particles, and their scattering properties, J. Appl. Meteorol. Clim., 55, 691–708, https://doi.org/10.1175/JAMC-D-15-0130.1, 2016. a
Leinonen, J., Lebsock, M. D., Tanelli, S., Sy, O. O., Dolan, B., Chase, R. J., Finlon, J. A., von Lerber, A., and Moisseev, D.: Retrieval of snowflake microphysical properties from multifrequency radar observations, Atmos. Meas. Tech., 11, 5471–5488, https://doi.org/10.5194/amt-11-5471-2018, 2018. a
Liebe, H. J., Hufford, G. A., and Cotton, M. G.: Propagation modeling of moist air and suspended water/ice particles at frequencies below 1000 GHz, in: AGARD 52nd Spec. Meet. Electromagn. Wave Propag. Panel, pp. 3–10, Palma de Mallorca, Spain, 1993. a
Liu, G.: A database of microwave single-scattering properties for nonspherical ice particles, Bull. Am. Meteorol. Soc., 89, 1563, https://doi.org/10.1175/2008BAMS2486.1, 2008. a, b, c
Lu, Y., Jiang, Z., Aydin, K., Verlinde, J., Clothiaux, E. E., and Botta, G.: A polarimetric scattering database for non-spherical ice particles at microwave wavelengths, Atmos. Meas. Tech., 9, 5119–5134, https://doi.org/10.5194/amt-9-5119-2016, 2016. a
McFarquhar, G. M. and Heymsfield, A. J.: Parameterization of tropical cirrus ice crystal size distributions and implications for radiative transfer: Results from CEPEX, J. Atmos. Sci., 54, 2187–2200, https://doi.org/10.1175/1520-0469(1997)054<2187:POTCIC>2.0.CO;2, 1997. a, b, c
Meirold-Mautner, I., Prigent, C., Defer, E., Pardo, J. R., Chaboureau, J.-P., Pinty, J.-P., Mech, M., and Crewell, S.: Radiative transfer simulations using mesoscale cloud model outputs: Comparisons with passive microwave and infrared satellite observations for midlatitudes, J. Atmos. Sci., 64, 1550–1568, https://doi.org/10.1175/JAS3896.1, 2007. a
Mishchenko, M. I.: Calculation of the amplitude matrix for a nonspherical particle in a fixed orientation, Appl. Optics, 39, 1026, https://doi.org/10.1364/AO.39.001026, 2000. a
Ori, D., Maestri, T., Rizzi, R., Cimini, D., Montopoli, M., and Marzano, F. S.: Scattering properties of modeled complex snowflakes and mixed-phase particles at microwave and millimeter frequencies, J. Geophys. Res.-Atmos., 119, 9931–9947, https://doi.org/10.1002/2014JD021616, 2014. a
Pfreundschuh, S., Eriksson, P., Buehler, S. A., Brath, M., Duncan, D., Larsson, R., and Ekelund, R.: Synergistic radar and radiometer retrievals of ice hydrometeors, Atmos. Meas. Tech. Discuss., https://doi.org/10.5194/amt-2019-369, in review, 2019. a
Protat, A., Delanoë, J., Strapp, J. W., Fontaine, E., Leroy, D., Schwarzenboeck, A., Lilie, L., Davison, C., Dezitter, F., Grandin, A., and Weber, M.: The measured relationship between ice water content and cloud radar reflectivity in tropical convective clouds, J. Appl. Meteorol. Clim., 55, 1707–1729, https://doi.org/10.1175/JAMC-D-15-0248.1, 2016. a, b, c, d, e, f, g
Ringerud, S., Kulie, M. S., Randel, D. L., Skofronick-Jackson, G. M., and Kummerow, C. D.: Effects of ice particle representation on passive microwave precipitation retrieval in a Bayesian scheme, IEEE T. Geosci. Remote, 57, 3619–3632, https://doi.org/10.1109/tgrs.2018.2886063, 2019. a
Rosenkranz, P. W.: Water vapor microwave continuum absorption: A comparison of measurements and models, Radio Sci., 33, 919–928, https://doi.org/10.1029/98RS01182, 1998. a
Rydberg, B., Eriksson, P., Buehler, S. A., and Murtagh, D. P.: Non-Gaussian Bayesian retrieval of tropical upper tropospheric cloud ice and water vapour from Odin-SMR measurements, Atmos. Meas. Tech., 2, 621–637, https://doi.org/10.5194/amt-2-621-2009, 2009. a, b
Rysman, J.-F., Panegrossi, G., Sanò, P., Marra, A., Dietrich, S., Milani, L., and Kulie, M.: SLALOM: An all-surface snow water path retrieval algorithm for the GPM Microwave Imager, Remote Sens., 10, 1278, https://doi.org/10.3390/rs10081278, 2018. a
Shupe, M. D., Kollias, P., Matrosov, S. Y., Schneider, T. L., and Shupe, M. D.: Deriving mixed-phase cloud properties from doppler radar spectra, J. Atmos. Oceanic Technol., 21, 660–670, https://doi.org/10.1175/1520-0426(2004)021<0660:DMCPFD>2.0.CO;2, 2004. a
Skofronick-Jackson, G., Heymsfield, A., Holthaus, E., Albers, C., and Kim, M.-J.: Nonspherical and spherical characterization of ice in Hurricane Erin for wideband passive microwave comparisons, J. Geophys. Res., 113, D06201, https://doi.org/10.1029/2007JD008866, 2008. a
Sreerekha, T., Buehler, S., O'Keeffe, U., Doherty, A., Emde, C., and John, V.: A strong ice cloud event as seen by a microwave satellite sensor: Simulations and observations, J. Quant. Spectrosc. Ra., 109, 1705–1718, https://doi.org/10.1016/j.jqsrt.2007.12.023, 2008. a
Stephens, G. L., Vane, D. G., Tanelli, S., Im, E., Durden, S., Rokey, M., Reinke, D., Partain, P., Mace, G. G., Austin, R., L'Ecuyer, T., Haynes, J., Lebsock, M., Suzuki, K., Waliser, D., Wu, D., Kay, J., Gettelman, A., Wang, Z., and Marchand, R.: CloudSat mission: Performance and early science after the first year of operation, J. Geophys. Res., 113, D00A18, https://doi.org/10.1029/2008JD009982, 2008. a, b, c
Tang, G., Panetta, R. L., Yang, P., Kattawar, G. W., and Zhai, P.-W.: Effects of ice crystal surface roughness and air bubble inclusions on cirrus cloud radiative properties from remote sensing perspective, J. Quant. Spectrosc. Ra., 195, 119–131, https://doi.org/10.1016/j.jqsrt.2017.01.016, 2017. a
Wang, J., Dong, X., Xi, B., and Heymsfield, A. J.: Investigation of liquid cloud microphysical properties of deep convective systems: 1. Parameterization raindrop size distribution and its application for stratiform rain estimation, J. Geophys. Res.-Atmos., 121, 10739–10760, https://doi.org/10.1002/2016JD024941, 2016. a
Wu, D., Jiang, J., and Davis, C.: EOS MLS cloud ice measurements and cloudy-sky radiative transfer model, IEEE T. Geosci. Remote, 44, 1156–1165, https://doi.org/10.1109/TGRS.2006.869994, 2006. a, b
Yang, P., Wei, H., Huang, H.-l., Baum, B. A., Hu, Y. X., Kattawar, G. W., Mishchenko, M. I., and Fu, Q.: Scattering and absorption property database for nonspherical ice particles in the near- through far-infrared spectral region, Appl. Optics, 44, 5512, https://doi.org/10.1364/AO.44.005512, 2005. a
Yin, M. and Liu, G.: Assessment of GPM high frequency microwave measurements with radiative transfer simulation under snowfall conditions, Q. J. Roy. Meteorol. Soc., 145, 1603–1616, https://doi.org/10.1002/qj.3515, 2019. a, b, c, d
Yin, M., Liu, G., Honeyager, R., and Joseph Turk, F.: Observed differences of triple-frequency radar signatures between snowflakes in stratiform and convective clouds, J. Quant. Spectrosc. Ra., 193, 13–20, https://doi.org/10.1016/j.jqsrt.2017.02.017, 2017. a